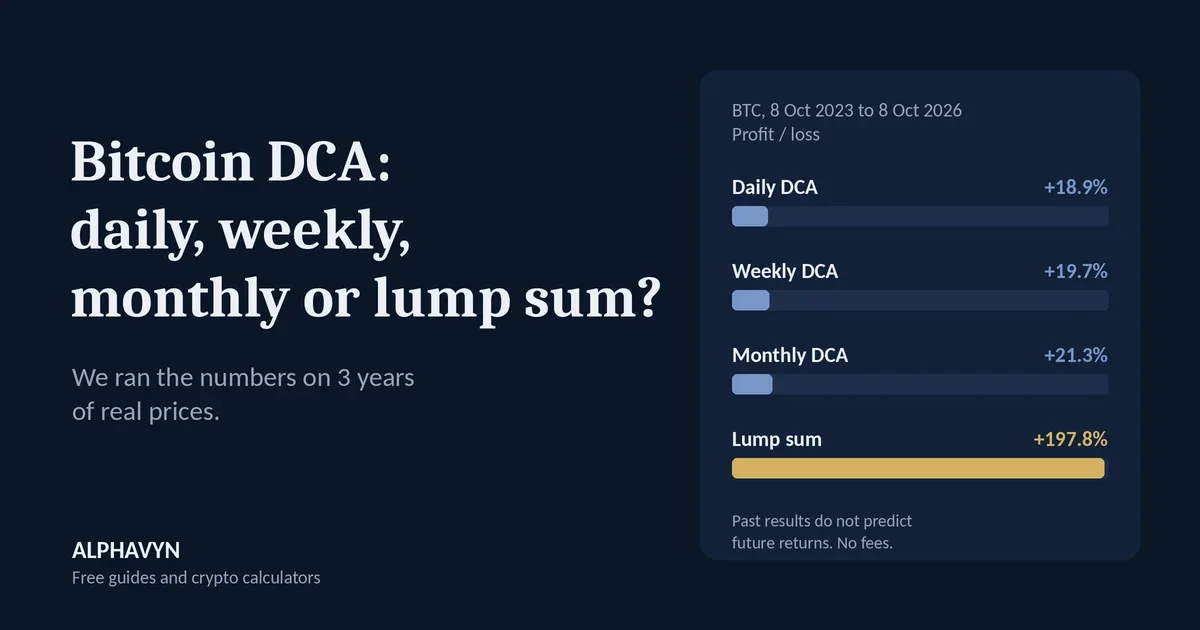
Should you buy Bitcoin every day, every week, or every month? And is spreading your buys out better than investing everything at once? Instead of guessing, we ran the numbers on three years of real prices using our free DCA calculator. Every figure below links to the exact calculation, so you can open it and check it yourself.
What is DCA (dollar-cost averaging)?
Dollar-cost averaging, or DCA, means investing a fixed amount at regular intervals, no matter what the price is. When the price is low, the fixed amount buys more coins; when it is high, it buys fewer. Over time, your average buy price reflects the whole period instead of one single moment.
The alternative is a lump sum: investing the full amount in one go.
DCA is popular because it removes the need to pick the "right" day to buy. But it is a method for spreading out timing, not a way to guarantee a profit, as the results below show.
What did we test?
We used ALPHAVYN's DCA calculator and What if I invested tool with these settings:
Coin: Bitcoin (BTC), plus a weekly check for ETH and SOL
Amount: 100 USDT per buy
Start date: 8 October 2023
End date: 8 October 2026 (the day we ran the numbers)
Frequencies: every day, every week, and every month
Lump sum: the same total as the weekly plan (15,700 USDT), invested in full on 8 October 2023
Fees: not included
Data from ALPHAVYN's DCA calculator, using daily closing prices, as of 8 October 2026. All runs were done on the same morning within about 35 minutes, so the "value today" figures use very slightly different live prices.
Results: daily vs weekly vs monthly vs lump sum
BTC, from 8 Oct 2023 | Daily DCA | Weekly DCA | Monthly DCA | Lump sum |
|---|---|---|---|---|
Number of buys | 1,097 | 157 | 37 | 1 |
Total put in | 109,700.00 USDT | 15,700.00 USDT | 3,700.00 USDT | 15,700.00 USDT |
Value today | 130,431.11 USDT | 18,797.01 USDT | 4,488.69 USDT | 46,748.43 USDT |
Profit/loss | +18.9% | +19.7% | +21.3% | +197.8% |
Average buy price | 69,934.46 | 69,490.25 | 68,553.77 | 27,917.05 |
Coins held | 1.5686 BTC | 0.225931 BTC | 0.053972 BTC | 0.562380 BTC |
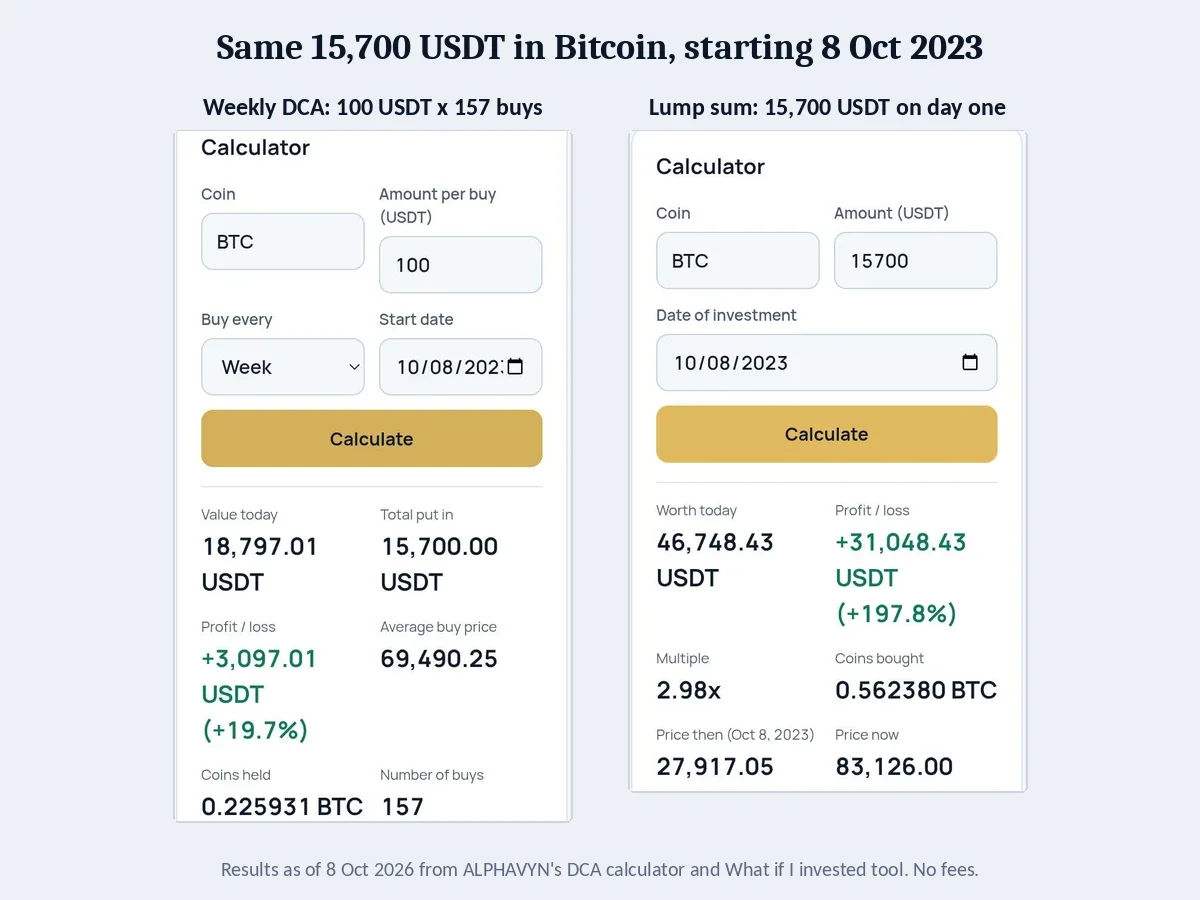
Open each calculation: daily, weekly, monthly, lump sum.
The totals put in are different because daily buying means more buys. To compare the methods fairly, look at the profit/loss percentage and the average buy price.
Did buying more often make a real difference?
Not much. The three DCA plans ended within 2.4 percentage points of each other, and their average buy prices were within about 2% (68,553.77 for monthly versus 69,934.46 for daily).
In this period, monthly buying came out slightly ahead. That is not because monthly is a better rule. Its 37 buy days happened to land, on average, on slightly lower prices. With a different start date or a different day of the month, the order could easily change.
The practical lesson is that the frequency matters far less than people think. Pick the schedule that fits how you get paid and how often you want to act, and stick with it. Daily buying also means many more transactions, which can add up in fees.
Why did the lump sum do so much better here?
The lump sum bought all its Bitcoin on 8 October 2023 at 27,917.05. The DCA plans kept buying for three years, through a period when the price climbed well above that level, which pushed their average buy price up to around 69,500.
With the same 15,700 USDT, the lump sum ended with 0.562380 BTC, about 2.5 times as many coins as the weekly plan's 0.225931 BTC.
There is a second reason. The lump sum had all of its money invested from the first day. The weekly plan only reached its full 15,700 USDT at the very end, so on average much of its money was invested for a shorter time.
When does DCA beat a lump sum?
Our test covers one period, and in that period the price rose strongly soon after the start date. That is the situation where a lump sum does best.
The picture changes when the start date falls near a high and the price drops afterward. A lump sum invested at a peak carries the full drop at once, while a DCA plan keeps buying at lower prices and lowers its average buy price. Which method wins depends on the path the price takes after you start, and nobody knows that path in advance.
That is also why DCA appeals to many people: it reduces the risk of putting everything in at the worst possible moment, at the cost of usually doing worse when prices rise steadily. You can test this yourself by trying different start dates in the DCA calculator and the What if I invested tool.
How did ETH and SOL compare?
We ran the same weekly plan (100 USDT per week from 8 October 2023) and the same 15,700 USDT lump sum for Ethereum and Solana.
Weekly DCA vs lump sum | BTC | ETH | SOL |
|---|---|---|---|
Weekly DCA profit/loss | +19.7% | +0.9% | +4.9% |
Weekly DCA average buy price | 69,490.25 | 2,557.16 | 110.75 |
Lump sum profit/loss | +197.8% | +57.9% | +401.7% |
Lump sum buy price (8 Oct 2023) | 27,917.05 | 1,632.84 | 23.22 |
Open each calculation: ETH weekly and lump sum, SOL weekly and lump sum.
The pattern is the same for all three coins in this period, but notice the ETH weekly result: after three years and 157 buys, the plan was close to break-even at +0.9%. Its average buy price of 2,557.16 was only slightly below the price on the day we ran the numbers. Three years of steady buying does not guarantee a meaningful gain.
What DCA does not do
DCA does not prevent losses. If the price ends below your average buy price, the plan is in loss, no matter how disciplined it was. It also does not pick good coins for you: spreading buys over time into an asset that keeps falling still loses money.
What DCA does is spread your entry over many prices, so no single day decides your result. Whether that is the right approach depends on your situation and your tolerance for risk. Crypto assets are volatile, and the U.S. SEC notes that the risk of loss remains significant.
If you add to a position after a drop instead of on a schedule, see our guide on your average buy price and when averaging down hurts.
Try your own coin and dates
Every result in this article can be changed. Open the DCA calculator, choose any coin, amount, frequency, and start date, and compare it with a lump sum in What if I invested. If you already bought at several prices, the average price calculator shows your current average entry and profit or loss.
Frequently asked questions
Is weekly DCA better than monthly DCA?
In our test, the difference was small: +19.7% for weekly and +21.3% for monthly over three years. Neither frequency is better in general. Which one ends slightly ahead depends on the exact days the buys happen to land on.
Does DCA work in bear markets?
DCA keeps buying when prices fall, which lowers the average buy price. If the price later recovers above that average, the plan can end in profit. If it does not recover, the plan stays in loss. DCA changes how you enter, not whether the market goes up.
Should fees be considered?
Yes. Our results do not include fees. Every buy usually has a fee, so a daily plan with 1,097 buys pays far more fees than a monthly plan with 37 buys. If your platform has a minimum fee per order, small daily buys can lose a noticeable share to fees.
Do past results predict future returns?
No. These results describe one specific period, from 8 October 2023 to 8 October 2026. A different start date, end date, or coin can give a very different outcome, and past results do not predict future returns.
Want to see how a different start date changes the result? Try your own numbers in the free DCA calculator.