Blog
Practical guides on reading crypto signals, placing a stop loss, sizing positions and managing risk, written with real numbers and our free calculators. Every article explains one idea clearly and ends with what to check before you trade. Education only, not financial advice.
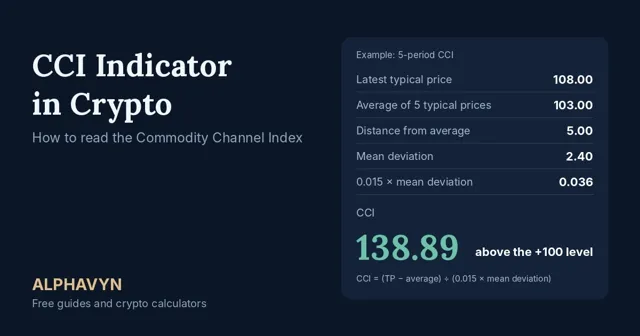
CCI Indicator in Crypto: How to Read the Commodity Channel Index
CCI, the Commodity Channel Index, measures how far the price is from its recent average, in units of its usual deviation. Readings above +100 or below −100 mean an unusually large move, which can show strength in a trend or a stretch in a range.
October 27, 2026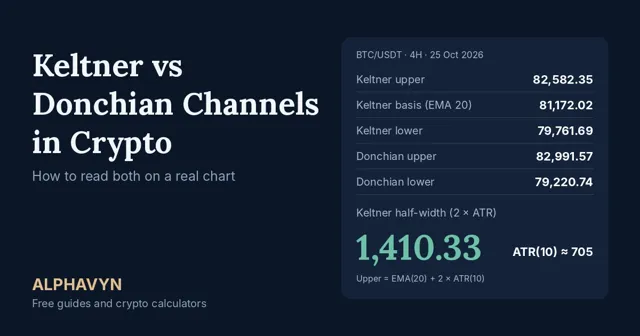
Keltner vs Donchian Channels in Crypto: How to Read Both
Keltner Channels draw bands at a set multiple of ATR around a moving average, while Donchian Channels draw the highest high and lowest low of the last N candles. Keltner follows volatility; Donchian follows the price range. Both are used to spot breakouts.
October 26, 2026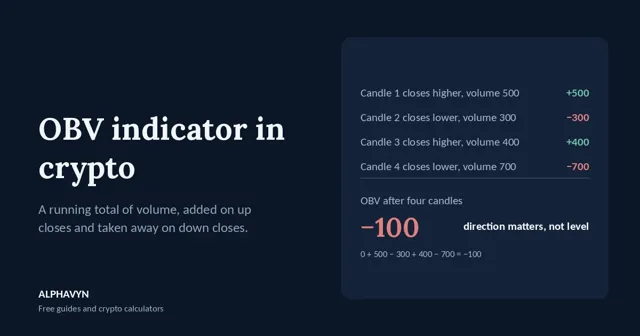
OBV Indicator in Crypto: How to Read On-Balance Volume
OBV adds a candle’s volume when it closes higher and subtracts it when it closes lower, as a running total. The number itself doesn’t matter; its direction does. Rising OBV shows volume behind up moves, falling OBV behind down moves. When OBV and price disagree, the move may be weakening.
October 24, 2026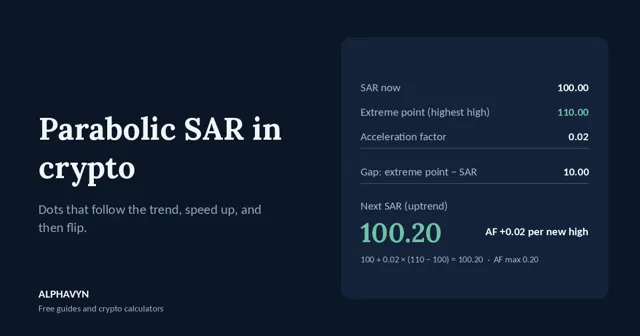
Parabolic SAR in Crypto: How to Read the Dots
Parabolic SAR places dots below the price in an uptrend and above it in a downtrend. The dots move closer each candle and speed up as the trend makes new extremes. When the price touches the dots, they flip to the other side. Many traders use the dots as a trailing stop.
October 24, 2026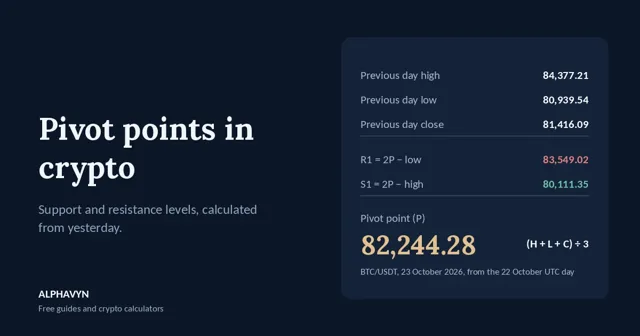
Pivot Points in Crypto: How to Calculate and Use Them
Pivot points are support and resistance levels calculated from the previous day’s high, low and close. P is the average of the three; R1–R3 sit above it and S1–S3 below. Price above P leans bullish for the day, below it bearish. On ALPHAVYN, daily pivots use the previous UTC day.
October 23, 2026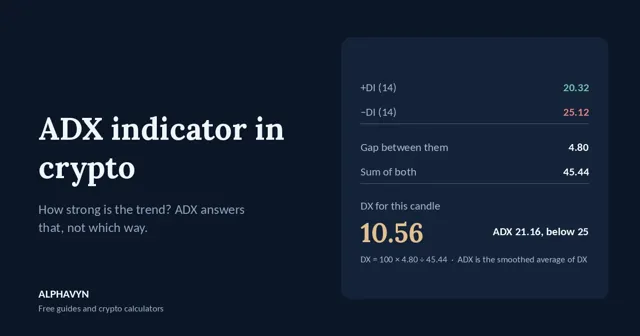
ADX Indicator in Crypto: How to Measure Trend Strength
ADX measures how strong a trend is, from 0 to 100, but not its direction. +DI and −DI show direction: +DI above −DI leans up, −DI above leans down. ADX above 25 is often read as a trending market, below 20 as weak. A rising ADX means the trend is strengthening.
October 23, 2026
Best Time to Trade Crypto: Asia, London and New York Sessions
Crypto trades 24/7, but activity follows the Asia, London and New York sessions. During summer time, Asia runs 00:00–09:00 UTC, London 07:00–16:00 and New York 12:00–21:00. The London–New York overlap is often the busiest stretch. Weekends are often quieter.
October 22, 2026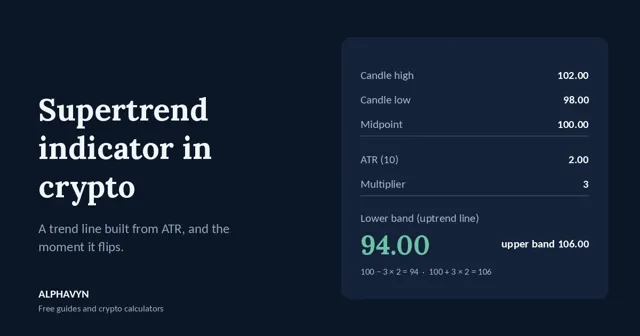
Supertrend Indicator in Crypto: How to Read the Flips
Supertrend is a trend line drawn a set number of ATRs above or below the price. Green below the price shows an uptrend; red above it shows a downtrend. It flips when a candle closes on the other side. The line only moves with the trend, so many traders use it as a trailing stop.
October 22, 2026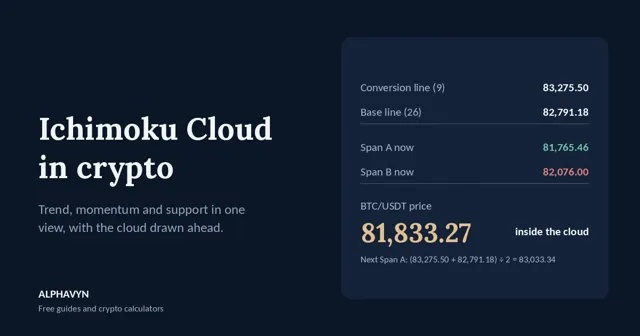
Ichimoku Cloud in Crypto: How to Read Every Line
Ichimoku shows trend, momentum and support in one view. Price above the cloud points to an uptrend, below it to a downtrend, and inside it to no clear trend. A green cloud means Span A is above Span B; red means below. The cloud is drawn ahead, so you see the levels coming next.
October 22, 2026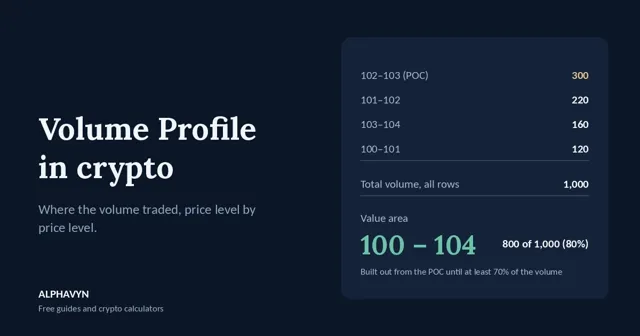
Volume Profile in Crypto: POC, Value Area and How to Read It
Volume Profile shows how much volume traded at each price, as horizontal bars beside the chart. The POC is the price with the most volume, and the value area holds 70% of it. High-volume levels often act as support or resistance; price tends to move quickly through low-volume gaps.
October 22, 2026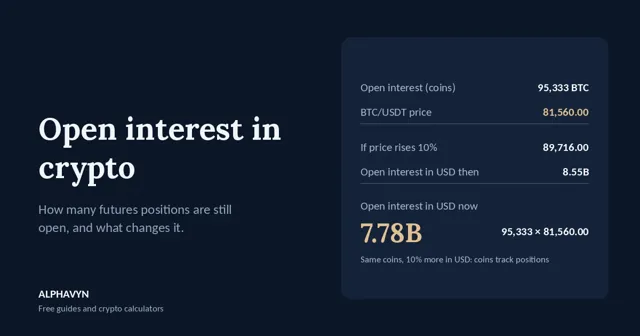
Open Interest in Crypto: What It Means and How to Read It
Open interest is the number of futures contracts still open. It rises when new positions open and falls when they close or are liquidated. Read it with price: rising price and rising open interest mean new positions are behind the move; falling open interest means positions are closing.
October 20, 2026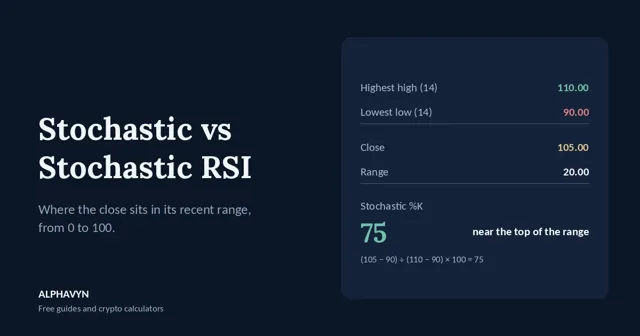
Stochastic vs Stochastic RSI in Crypto: How to Read Both
Stochastic shows where the close sits in its recent high-low range, from 0 to 100. Stochastic RSI applies the same idea to RSI, so it moves faster. Above 80 is often called overbought and below 20 oversold, but both can stay there in trends. Read %K and %D crosses with the trend and levels.
October 17, 2026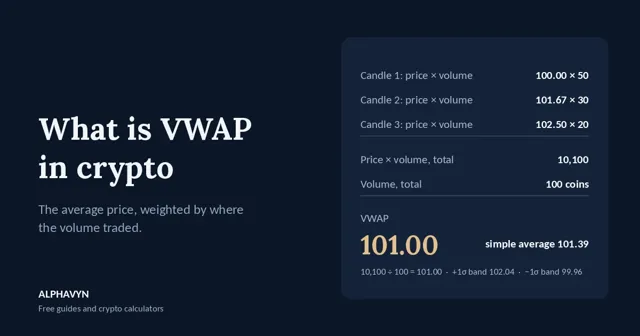
What Is VWAP in Crypto? How to Calculate and Use It
VWAP is the average price weighted by volume, so prices where more coins traded count more. It restarts each day, week or month. Price above VWAP is trading above the period’s average; below VWAP, under it. Traders use it as a fair-value line and a level, not a signal on its own.
October 17, 2026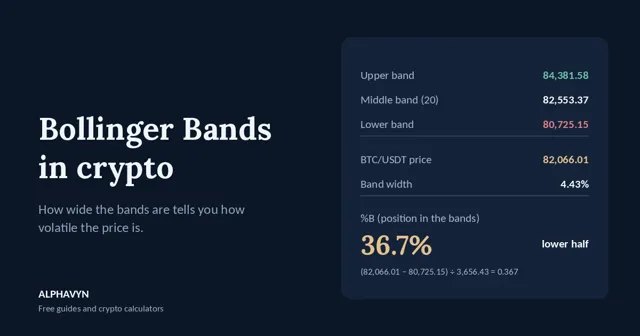
Bollinger Bands in Crypto: Squeeze, %B and How to Read the Bands
Bollinger Bands put a band 2 standard deviations above and below a 20-period moving average, so they widen when the price is volatile and narrow when it’s calm. A touch of the upper band isn’t a sell signal: in trends, price can ride a band. Narrow bands often precede bigger moves.
October 16, 2026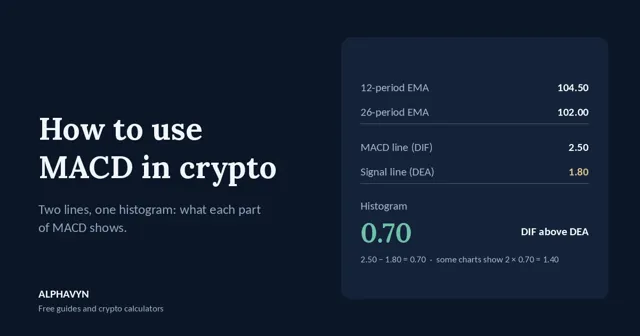
How to Use MACD in Crypto: Crossovers, Histogram and Divergence
MACD measures momentum by comparing a 12-period and a 26-period EMA. The MACD line is their difference; the signal line is its 9-period EMA, and the histogram shows the gap between them. Crossovers and the zero line help read momentum, but MACD lags and gives false signals in ranges.
October 16, 2026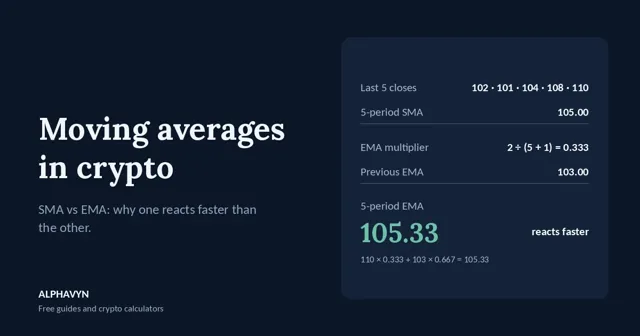
Moving Averages in Crypto: SMA, EMA, WMA and HMA Explained
A moving average smooths the price by averaging its last closes. The SMA weights every close equally, while the EMA gives more weight to recent ones, so it reacts faster. Price above a rising average points to an uptrend, but averages lag and give false crossovers in sideways markets.
October 16, 2026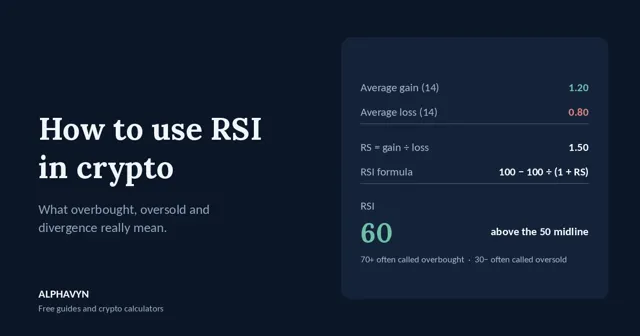
How to Use RSI in Crypto: Overbought, Oversold and Divergence
RSI measures how strong recent gains are compared with recent losses, on a scale from 0 to 100. Above 70 is often called overbought, and below 30 is oversold, but in strong trends, RSI can stay there a long time. Use it with trend and support or resistance, not as a buy or sell signal on its own.
October 16, 2026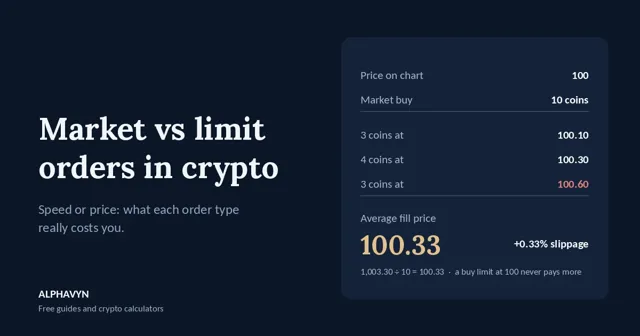
Market vs Limit Orders in Crypto: Which One to Use and When
A market order fills now at the best price available, so you get speed but not a set price. A limit order fills only at your price or better, so you get the price but no guarantee it fills. Use limit orders for planned entries and targets, and market orders when speed matters more than price.
October 15, 2026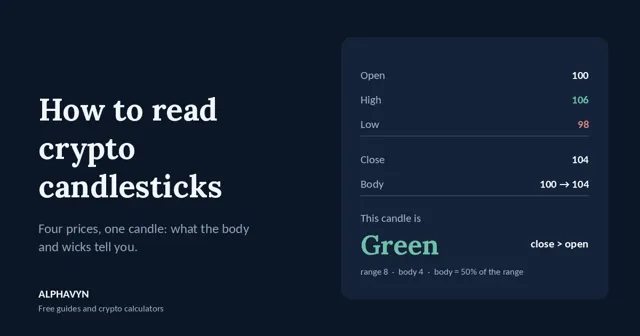
How to Read Crypto Candlestick Charts: A Beginner’s Guide
A candlestick shows four prices for one period: open, high, low and close. The body runs from open to close, green if the price rose and red if it fell, and the wicks show the high and low. Read candles at key levels and wait for the close, not the wick, before acting.
October 15, 2026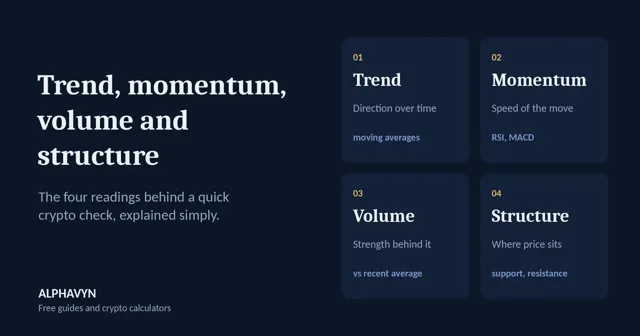
Trend, Momentum, Volume, and Structure in Crypto, Explained
Trend shows which way the price has been moving, momentum shows how strongly, volume shows how much trading backs the move, and structure shows where the price sits between support and resistance. When all four agree, the picture is clear; when they disagree, it is usually better to wait.
October 12, 2026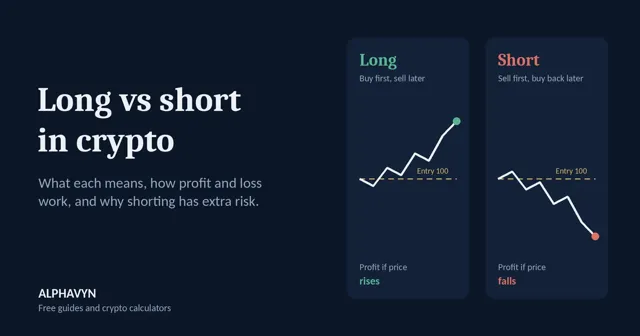
Long vs Short in Crypto, Explained for Beginners
Going long means buying a coin because you expect the price to rise; going short means selling first because you expect it to fall, then buying back lower. A long can lose at most what you paid, but a short’s loss has no fixed limit, because a price can keep rising.
October 12, 2026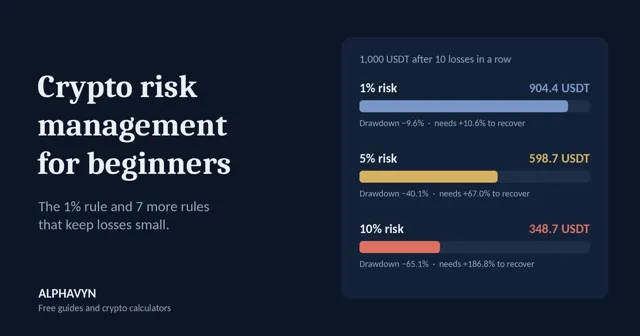
Crypto Risk Management for Beginners: The 1% Rule and More
Crypto risk management means deciding how much you can lose before every trade. The core is the 1% rule: risk a fixed share of your account per trade. Ten losses at 1% cost about 9.6%; at 10%, about 65%.
October 9, 2026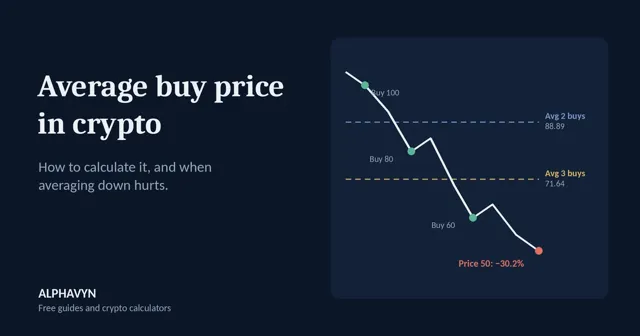
How to Calculate Your Average Buy Price in Crypto
Your average buy price is the total you spent divided by the total coins you bought. Buying 500 USDT at 100 and 500 USDT at 80 gives 11.25 coins at an average of 88.89. Buying more as the price falls lowers the average, but it also adds money at risk if the price keeps falling.
October 9, 2026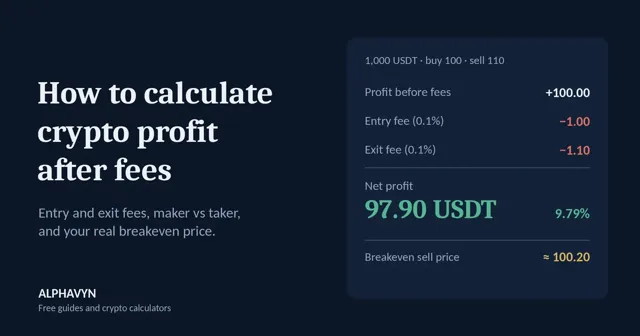
How to Calculate Crypto Profit After Fees
To calculate crypto profit, multiply the coins you hold by the difference between your sell and buy price, then subtract the fees on both the buy and the sell. Buying 1,000 USDT at 100 and selling at 110 makes 100 USDT before fees, but about 97.90 USDT after a 0.1% fee on each order.
October 9, 2026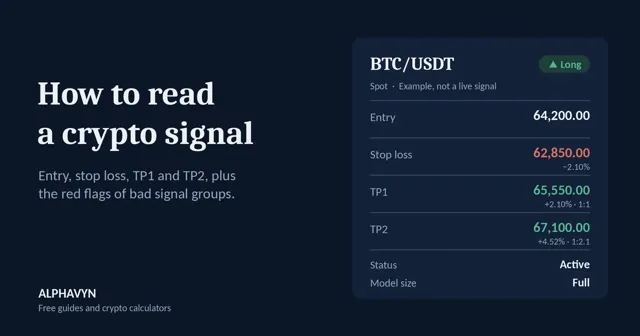
How to Read a Crypto Signal: Entry, Stop Loss, TP1 and TP2
A crypto signal is a trade idea with fixed levels: pair, direction, entry, stop loss, and targets. Check the stop loss first, verify the reward-to-risk, and size the trade yourself. Avoid any group that promises guaranteed profit, skips the stop-loss, or asks for your funds or keys.
October 9, 2026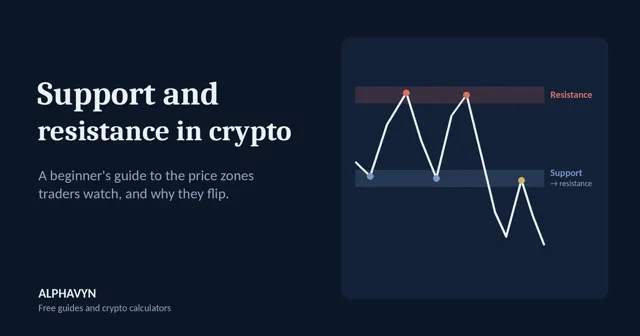
Support and Resistance in Crypto: A Beginner's Guide
Support is a price area where buying has stopped a fall before; resistance is an area where selling has stopped a rise. You find them from previous swing highs and lows, round numbers, and old ranges. Treat them as zones, not exact lines, and expect broken support to often act as resistance.
October 8, 2026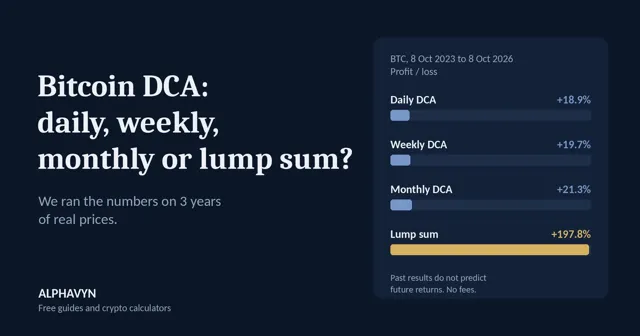
Bitcoin DCA: Daily vs Weekly vs Monthly vs Lump Sum
We ran 3 years of Bitcoin prices through our DCA calculator. Buying daily, weekly, or monthly gave almost identical results, between +18.9% and +21.3%. A lump sum on the start date performed far better (+197.8%) due to an immediate price surge. Thus, start date mattered more than frequency.
October 8, 2026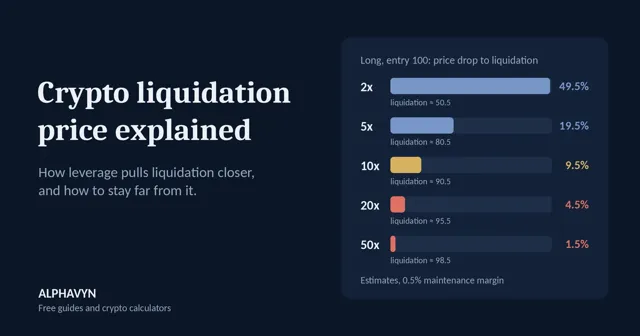
Crypto Liquidation Price Explained: How to Stay Far From It
A liquidation price is the level where a leveraged position is closed automatically because its margin can no longer cover the loss. The higher the leverage, the closer it sits to your entry: at 10x, a drop of under 10% can be enough. A stop loss well before that level keeps the exit in your hands.
October 8, 2026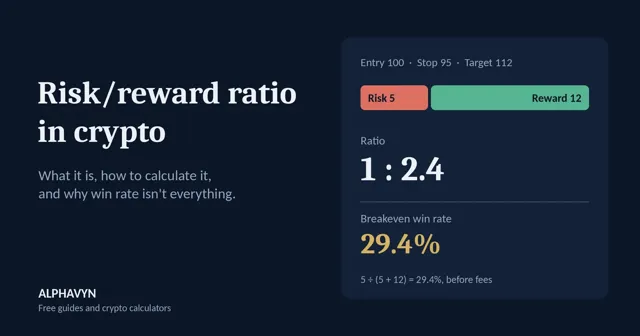
Risk/Reward Ratio in Crypto: Why Win Rate Isn't Everything
The risk/reward ratio compares what a trade could lose with what it could gain. Divide the reward by the risk and write it as 1:X. A higher ratio lowers the win rate you need to break even, but only if the target is realistic.
October 8, 2026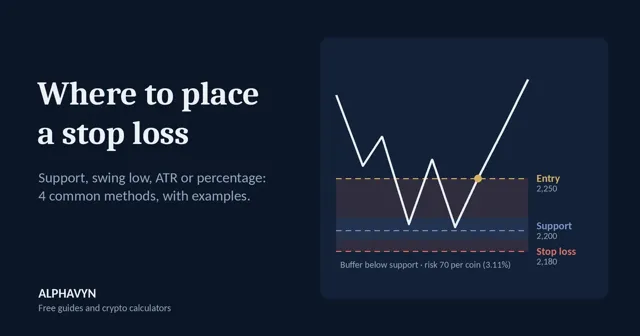
Where to Place a Stop Loss in Crypto: 4 Common Methods
Place a stop loss where your trade idea is proven wrong, not at a random percentage. Common methods are below support (above resistance for shorts), beyond the recent swing, a multiple of ATR, or a fixed percentage. Then size the trade so the stop costs only what you chose to risk.
October 6, 2026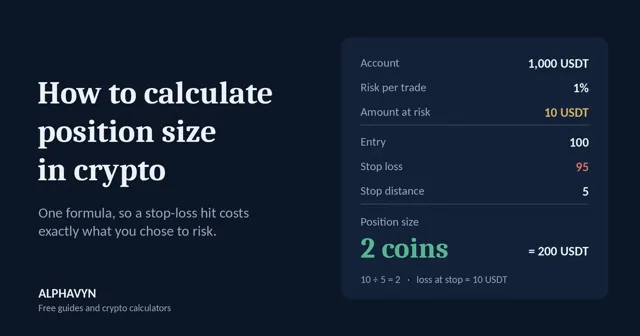
How to Calculate Position Size in Crypto (With Examples)
To calculate position size in crypto, multiply your account size by your risk per trade to get the amount at risk, then divide it by the distance between your entry and stop-loss. With 1,000 USDT, 1% risk, entry 100 and stop 95, you buy 2 coins.
October 6, 2026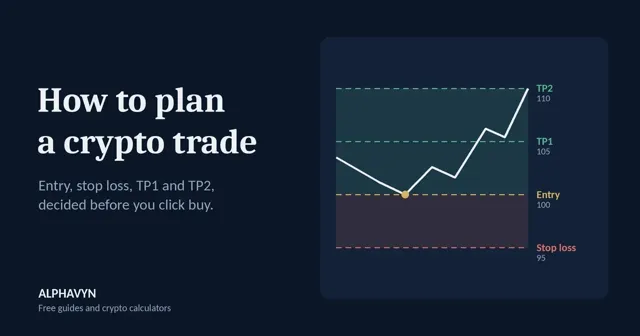
How to Plan a Crypto Trade: Entry, Stop Loss & Take Profit
To plan a crypto trade, decide your entry, stop loss, TP1 and TP2, and position size before you enter. Size the position so a stop-loss hit costs only a small, fixed share of your account. Writing the plan down first turns a guess into a set of rules you can follow.
October 3, 2026