Volume bars show how much traded in each candle, but on their own they don’t say much about direction: a tall bar can come on a rising candle or a falling one. On-Balance Volume, or OBV, ties the two together. It adds volume when the price closes up and takes it away when the price closes down, so over time it shows whether volume has been flowing into up moves or down moves. It’s one of the simplest volume indicators, and one of the most useful for checking whether a price move has real participation behind it. This guide explains how OBV is calculated, why its value can be negative, how to read its average line, and where it misleads, using a real BTC/USDT chart. You can add OBV to any USDT pair on our free live crypto charts.
What is OBV?
OBV was introduced by Joseph Granville in 1963. It’s a single line, drawn in its own panel below the chart, built as a running total of volume:
When a candle closes higher than the previous one, its volume is added.
When a candle closes lower, its volume is subtracted.
When the close is unchanged, OBV stays the same.
The idea behind it is that volume often moves before the price. If more and more volume shows up on up closes, buyers may be building positions, even if the price hasn’t moved much yet.
How is OBV calculated?
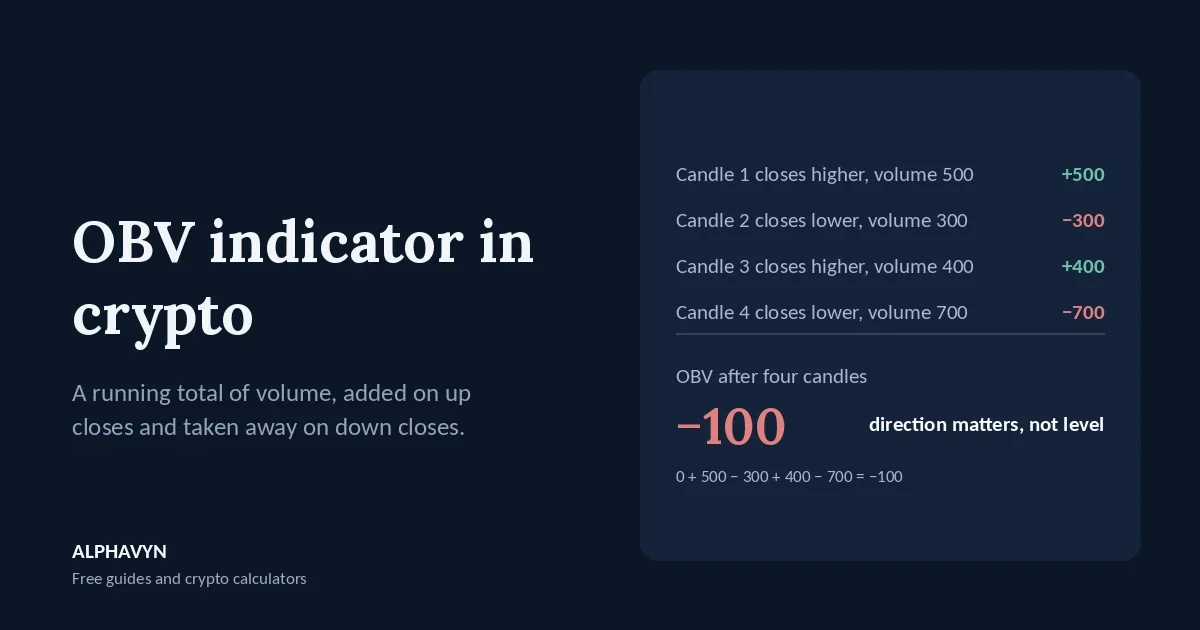
Example: four candles, starting from an OBV of 0.
Candle | Close compared with previous | Volume | Change | OBV |
|---|---|---|---|---|
1 | Higher | 500 | +500 | 500 |
2 | Lower | 300 | −300 | 200 |
3 | Higher | 400 | +400 | 600 |
4 | Lower | 700 | −700 | −100 |
After four candles, OBV is −100. Two candles closed up and two closed down, but the down candles carried more volume, so OBV ended below where it started.
Notice that OBV counts a candle’s full volume, whether it closed up by a lot or a little. A tiny up close on huge volume adds the whole amount. That keeps OBV simple, but it also means one very large candle can move it a lot.
Why can OBV be negative?
Because OBV is a running total, its value depends entirely on where the calculation starts. Start it on a different candle, and every number on the line changes, even though its shape stays the same. A negative OBV only means more volume has come on down closes than up closes since that starting point.
So the OBV number itself isn’t meaningful, and you can’t compare it between coins or between charts. What matters is:
Its direction: is OBV rising or falling?
Its highs and lows: is it making new highs or new lows along with the price?
Its position against its average: is it above or below its recent average?
How do I read OBV?
Rising OBV: more volume is coming on up closes. It supports a rising price.
Falling OBV: more volume is coming on down closes. It supports a falling price.
OBV and price moving together is called confirmation. A rally with rising OBV has volume behind it; a fall with falling OBV does too.
OBV and price moving apart is called divergence:
Bullish divergence: the price makes a lower low, but OBV makes a higher low. Selling volume is drying up even as the price falls.
Bearish divergence: the price makes a higher high, but OBV makes a lower high. The rally is happening on weaker volume.
As with RSI and MACD divergence, OBV divergence is a warning, not a timing signal. It can last for a long time before the price turns. Our guide on how to use RSI in crypto explains why many traders wait for the price itself to confirm.
What does the OBV average line show?
On our chart, OBV comes with an average line, MAOBV, which averages OBV over the last 30 candles by default. It works like a moving average on the price:
OBV above its average: recent volume has leaned toward up closes compared with the last 30 candles.
OBV below its average: recent volume has leaned toward down closes.
OBV crossing its average: the balance of volume has shifted.
Our guide to moving averages in crypto explains how averages smooth a line.
How do I read OBV on the ALPHAVYN chart?
Here is OBV on the BTC/USDT 4-hour chart at 16:20 UTC on 24 October 2026, with the price at 79,690.48. The label reads:
OBV(30) OBV: −14,468.8861 MAOBV: 5,709.3059
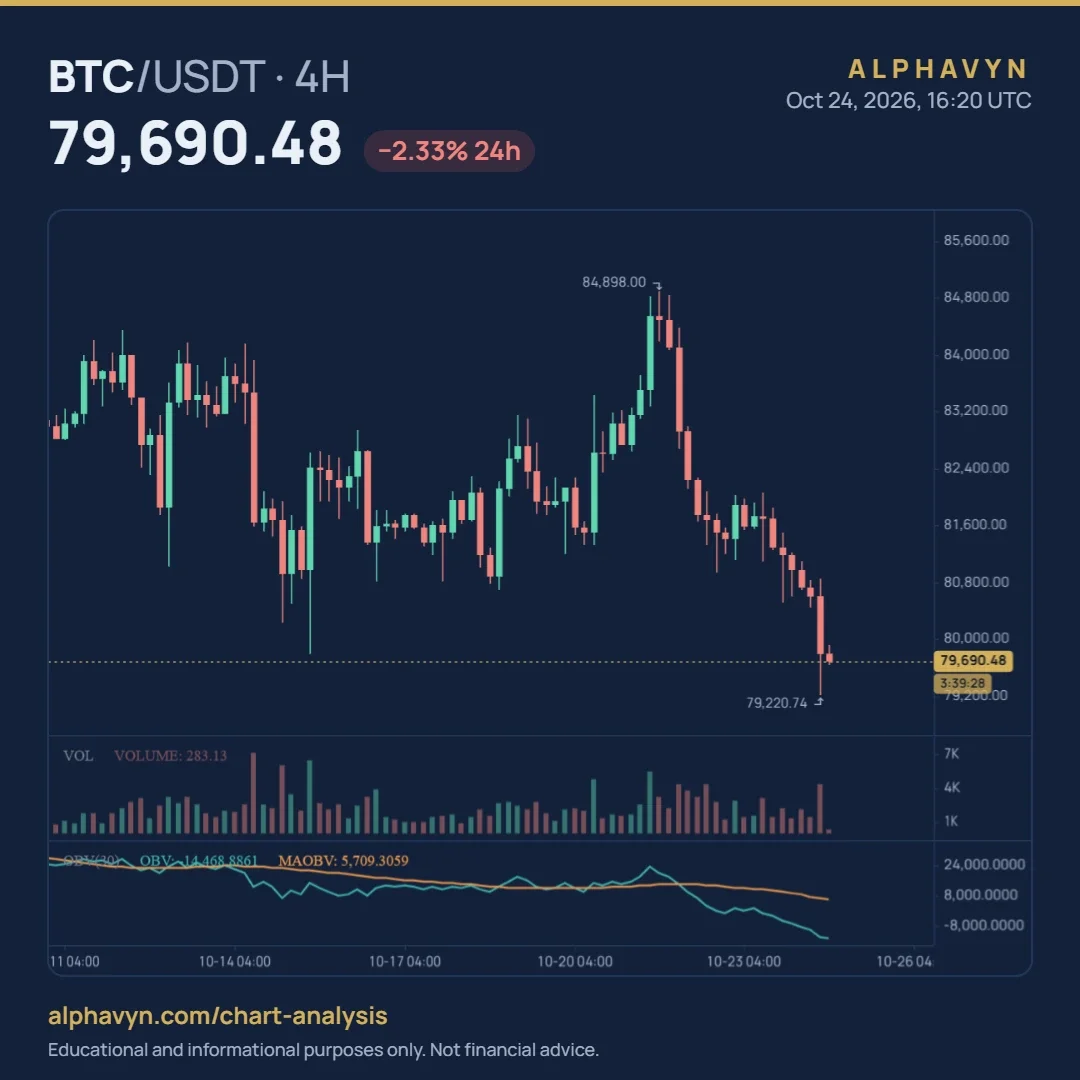
OBV is the current On-Balance Volume: −14,468.8861. The negative number only reflects where the calculation started; what matters is the direction.
MAOBV is its 30-candle average: 5,709.3059.
Reading it:
OBV is far below its average. At −14,468.89 against an average of 5,709.31, OBV is about 20,178 below the line. Over recent candles, much more volume has come on down closes than on up closes.
OBV is confirming the fall. As BTC dropped to a new low of 79,220.74, below the 79,800 low from mid-October, OBV fell to its lowest point on the chart. The price and the volume are moving the same way.
The chart also shows how OBV behaved over the previous two weeks:
A sideways stretch. Between about 16 and 20 October, while the price moved sideways, OBV stayed close to its average.
The rally and the turn. OBV rose with the rally to 84,898 on 21 October, then turned down with the price and fell below its average.
Steady selling since. From 22 October, OBV kept falling, and the gap below its average widened as the price slid lower.
You can change the length of the average from the default 30 in the indicator settings.
How do traders use OBV?
To confirm a breakout. A price breaking above resistance with OBV rising to a new high has volume behind it. A breakout while OBV stays flat or falls is weaker and more likely to fail. Our beginner’s guide to support and resistance explains how to judge a break.
To spot weakening moves. Divergence between OBV and the price can warn that a trend is losing support from volume.
With other volume tools. OBV shows the direction of volume over time. Volume Profile shows where volume traded by price, and VWAP shows the average price weighted by volume. Together, they give a fuller picture.
Whatever OBV shows, the trade still needs a stop loss where the idea would be wrong, and a position sized so the stop costs only what you chose to risk, using the position size calculator.
Should I change the average length?
The default 30 is a good balance. A shorter average, such as 10, reacts faster and crosses OBV more often. A longer one, such as 50, is smoother and slower. Changing the average doesn’t change OBV itself, only the line you compare it with.
What are the limits of OBV?
The value itself means nothing. It depends on where the calculation starts. Only direction and shape matter.
It counts full volume. A small up close on huge volume adds the whole amount, which can exaggerate one candle.
One spike can distort it. A single news-driven candle with very high volume can shift OBV for a long time.
Volume on small coins can mislead. On low-volume pairs, a few large trades can move OBV sharply.
Frequently asked questions
Why is OBV negative?
OBV is a running total that starts from a chosen candle. A negative value only means more volume has come on down closes than up closes since then. The number itself isn’t important; its direction is.
What is a good OBV value?
There isn’t one. OBV values can’t be compared between coins or charts. Look at whether OBV is rising or falling, whether it’s making new highs or lows with the price, and whether it’s above or below its average.
What does OBV divergence mean?
The price and OBV are moving in different directions, for example a new high in price without a new high in OBV. It suggests the move has weaker volume behind it. It’s a warning, not a signal on its own.
Is OBV reliable in crypto?
It’s a useful way to see whether volume supports a move, especially on busy pairs like BTC/USDT. No indicator is reliable on its own. Crypto assets are volatile, and the U.S. SEC notes that the risk of loss remains significant.
Open the free live crypto charts, add OBV to the 4-hour chart of a pair you follow, and check the last big move: did OBV rise or fall with it?