Two sets of lines on a price chart can look almost the same and still be built from completely different ideas. One asks how big the candles have been lately. The other asks only where the price has been. Once you know which is which, you also know what it really means when price touches the upper line.
In this guide, we’ll go through how each channel is calculated, how to read them side by side, and where they can mislead you, using a real BTC/USDT chart. You can add both to any USDT pair on our free live crypto charts and follow along.
What are Keltner Channels and Donchian Channels?
Both are overlays: three lines drawn on your price chart (an upper, a middle and a lower line), with price moving between them. Keltner Channels are named after Chester Keltner, and Donchian Channels after Richard Donchian, an early trend-following trader.
Channel | Upper line | Middle line | Lower line |
|---|---|---|---|
Keltner | Moving average plus a multiple of ATR | An EMA | Moving average minus a multiple of ATR |
Donchian | Highest high of the last N candles | Midpoint of the upper and lower lines | Lowest low of the last N candles |
On our chart, the settings are written as Keltner(20,10,2), which means a 20-period EMA, a 10-period ATR and a multiplier of 2. Donchian(20) means a range of the last 20 candles.
How are Keltner Channels calculated?
The middle line, which we call the basis on our chart, is an EMA. The outer lines sit a multiple of ATR above and below it:
Upper = EMA + multiplier × ATR
Lower = EMA − multiplier × ATR
ATR, the average true range, tells you how far price usually moves in one candle, wicks included. If you’d like to see ATR in action, our guide on where to place a stop loss in crypto explains it with an example, and our guide to the Supertrend indicator in crypto shows how another indicator uses it. And if EMAs are new to you, our guide to moving averages in crypto explains how they’re calculated.
Example: the EMA is 100, the ATR is 1.5 and the multiplier is 2.
Upper = 100 + 2 × 1.5 = 103
Lower = 100 − 2 × 1.5 = 97
When candles get bigger, ATR rises and the channel widens. When candles get smaller, it narrows. Your chart does all of this automatically for every candle.
How are Donchian Channels calculated?
Donchian Channels are even simpler, because they use no average at all. They only look at the extremes of the last N candles:
Upper = highest high of the last N candles
Lower = lowest low of the last N candles
Middle = (upper + lower) ÷ 2
Example: over the last 20 candles, the highest high is 108 and the lowest low is 94.
Middle = (108 + 94) ÷ 2 = 101
Width = 108 − 94 = 14
Remember that wicks count. One long wick can set the upper or lower line for as long as it stays inside the last N candles.
What is the difference between Keltner and Donchian Channels?
Here’s the quick side-by-side:
Keltner Channels | Donchian Channels | |
|---|---|---|
Built from | An EMA and ATR | The highest high and lowest low |
Settings on our chart | EMA 20, ATR 10, multiplier 2 | Period 20 |
Middle line | The EMA | The midpoint of the range |
Width set by | How large recent candles have been | How far price has travelled in N candles |
Shape of the lines | Smooth curves | Flat stretches and sudden steps |
Reaction to one long wick | Small, through the EMA and ATR | Immediate, the line jumps to the wick |
Common use | Reading volatility, pullbacks and closes outside the band | Reading breakouts from the recent range |
A simple way to remember it: Keltner asks, “Has price moved further from its average than candles usually do?” Donchian asks, “Has price left the range it traded in over the last N candles?”
How do the two channels react to the same sharp move?
Let’s test them on the same candle. Say a 20-candle range has a highest high of 108 and a lowest low of 94. The EMA is 100, ATR is 1.5 and the multiplier is 2, so the Keltner lines sit at 103 and 97. Then one candle closes at 110 with a high of 112.
Donchian: once that candle is among the last 20, the highest high is 112.
Upper moves from 108 to 112, in one step.
Middle moves from 101 to (112 + 94) ÷ 2 = 103.
Lower stays at 94.
The upper line stays at 112 until that candle is 20 candles old, even if price falls straight back. Then it drops in one step.
Keltner: an EMA only moves part of the way toward a new price. With a 20-period EMA, the weight on the newest price is 2 ÷ 21, about 0.095:
EMA = 110 × 0.095 + 100 × 0.905 ≈ 100.95
So the middle line moved less than 1 point, and the outer lines moved with it. ATR also rises a little, because that candle was large, which widens the channel slightly. The change is smooth, and it fades gradually as the candle ages.
That’s the main practical difference: Donchian jumps and holds, Keltner glides and fades.
How do I read Keltner and Donchian Channels on the ALPHAVYN chart?
Let’s look at a real chart. Here are both channels on the BTC/USDT 4-hour chart at 11:38 UTC on 25 October 2026, with price at 80,397.10. The labels read:
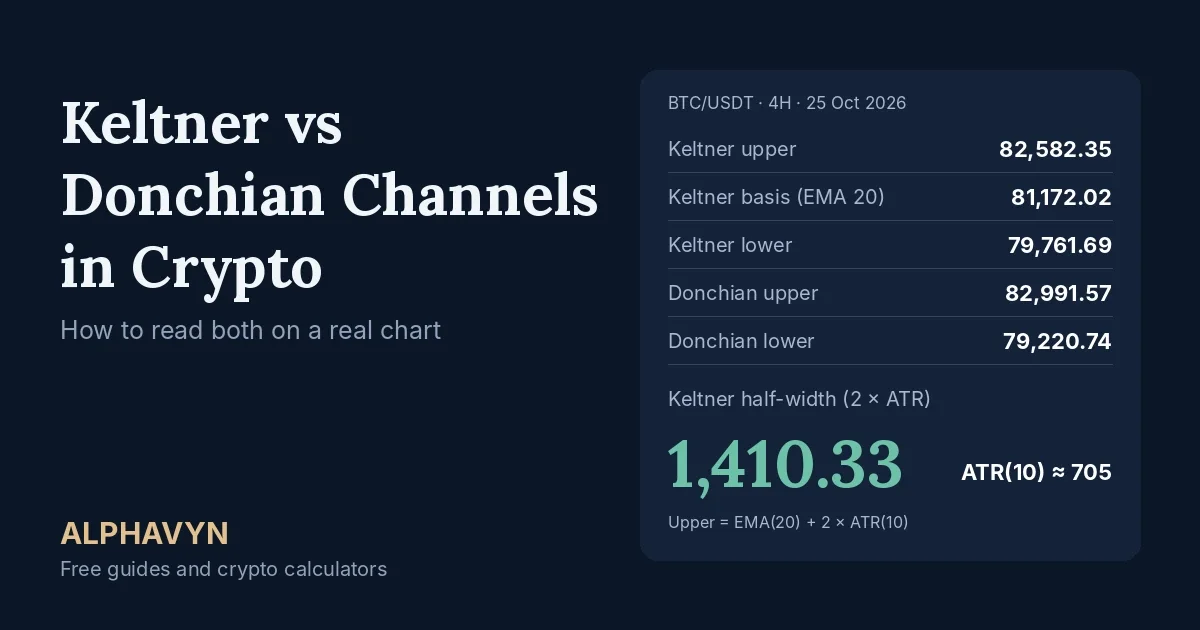
Keltner(20,10,2) Upper: 82,582.35 Basis: 81,172.02 Lower: 79,761.69
Donchian(20) Upper: 82,991.57 Basis: 81,106.15 Lower: 79,220.74
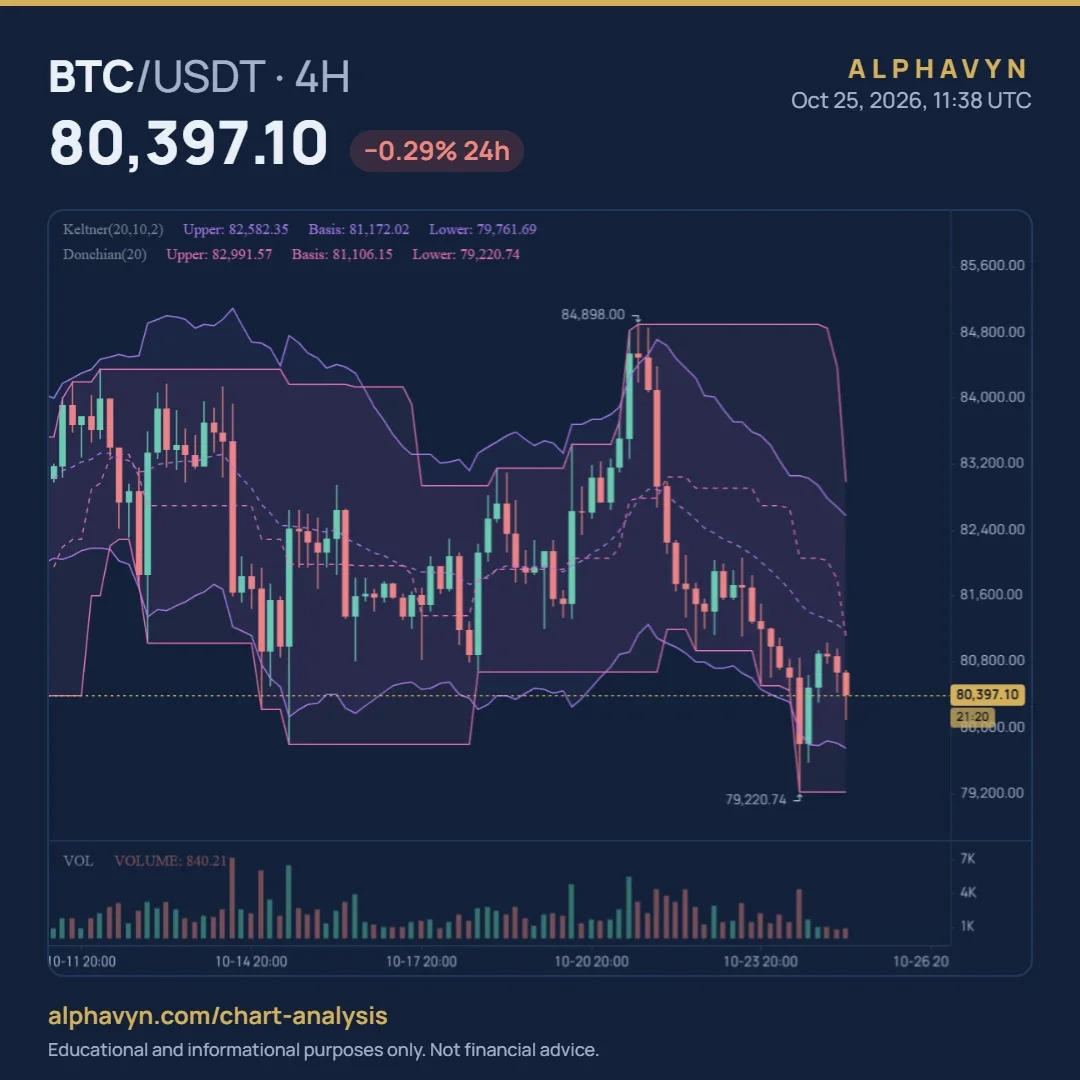
On a 4-hour chart, 20 candles cover 80 hours, a little over three days. Let’s read it step by step:
Price is inside both channels, in the lower part. At 80,397.10, it’s 774.92 below the Keltner basis and 635.41 above the Keltner lower line. Against Donchian, it’s 709.05 below the middle and 1,176.36 above the lower line.
Its position inside each channel differs. Using (price − lower) ÷ (upper − lower), price sits about 22.5% of the way up the Keltner channel and about 31.2% of the way up the Donchian channel. It works like the %B reading in our guide to Bollinger Bands in crypto.
Keltner’s width comes from ATR. The upper and lower lines are each 1,410.33 from the basis. That’s 2 × ATR, so the 10-period ATR is about 705.
Donchian is wider. Its channel is 3,770.83 wide against 2,820.66 for Keltner, because it uses the extreme wicks of 20 candles instead of an average. Its upper line is 409.22 above Keltner’s upper, and its lower line is 540.95 below Keltner’s lower.
The Donchian lower line is the labeled low. At 79,220.74, it’s the same price as the low marked near the bottom of the chart: the lowest low of the last 20 candles.
The 84,898 high is no longer in the window. The high marked near the top of the chart is 1,906.43 above the Donchian upper line, 82,991.57. It’s older than 20 candles, so it has dropped out of the range.
The Donchian middle is just the midpoint. (82,991.57 + 79,220.74) ÷ 2 is about 81,106.15, the basis in the label.
The chart also shows the difference in shape nicely. The pink Donchian lines stay flat for stretches and then step. After the rally to 84,898, the upper line stayed flat for a while, then stepped down once that high aged out. The purple Keltner lines bend gradually, narrowing and widening smoothly as candles got smaller and larger. In the last few days, price fell from the high toward the lower lines, and one recent candle dipped to the 79,220.74 low before recovering.
So what’s the bottom line? Both channels say the same thing in different ways: price is below the middle, in the lower part of both channels, and outside neither of them. That’s a mildly weak reading, not an extreme one.
You can change the numbers in each indicator’s settings.
How do traders use Keltner Channels?
To see whether a move is unusually large. A candle closing outside the upper or lower line means price has moved further from its average than candle sizes would normally allow. In a strong trend, price can ride a band for many candles, just like with Bollinger Bands. In a sideways market, a close outside the band often snaps back toward the middle.
For pullbacks in a trend. In an uptrend, pullbacks often stop near the basis, which is an EMA and so can act as dynamic support. Our guide on moving averages in crypto explains why.
With Bollinger Bands, to spot a squeeze. Some traders add both to one chart. When the Bollinger Bands move inside the Keltner Channel, price has been unusually calm, and calm periods often come before bigger moves. Keep in mind it tells you a move may be coming, not which direction. Our guide to Bollinger Bands in crypto covers the squeeze.
As a side filter. Some traders only look for long trades while price holds above the basis, and for short trades (or no trades) while it stays below.
How do traders use Donchian Channels?
For breakouts. A close above the upper line means price is at a new 20-candle high, and a close below the lower line means a new 20-candle low. The idea is that a market leaving its recent range may be starting a trend. Look at where the candle closes, not just the wick, as our guide on how to read crypto candlestick charts explains.
To judge a breakout. A breakout with strong volume and a rising ADX has more behind it than one on quiet trading. Our guides on trend, momentum, volume and structure and the ADX indicator in crypto show you how to check both.
For exits and stops. The lower line is the lowest low of the last 20 candles, which is a mechanical version of the swing low method in our guide on where to place a stop loss in crypto.
To mark a range. When the upper and lower lines stay flat and price moves between them, the market is ranging, and the two lines act as the edges of that range. Our beginner’s guide to support and resistance explains why edges work as zones, not exact prices.
And whatever the channels show, don’t skip the basics: the trade still needs a stop loss where your idea would be proven wrong, and a position sized so the stop costs only what you chose to risk. The position size calculator does that math for you.
How are Keltner Channels different from Bollinger Bands and Supertrend?
Bollinger Bands set their width from the standard deviation of closing prices, while Keltner Channels use ATR, the size of candles including wicks. Supertrend also uses ATR, but it draws one line that flips sides with the trend, while Keltner draws a channel around an average. Our guides to Bollinger Bands in crypto and the Supertrend indicator in crypto explain each one.
Should I change the Keltner and Donchian settings?
The defaults on our chart are EMA 20, ATR 10 and multiplier 2 for Keltner, and period 20 for Donchian. They’re a good place to start. Here’s what happens when you change them:
Change | Effect |
|---|---|
Keltner: higher multiplier (for example 3) | Lines sit further from the basis; fewer closes outside the band |
Keltner: lower multiplier (for example 1.5) | Lines sit closer; more closes outside the band |
Keltner: shorter EMA | The basis follows price more closely |
Keltner: shorter ATR (for example 5) | The width reacts faster to changes in candle size |
Donchian: shorter period (for example 10) | Lines sit closer to price; new highs and lows come more often, with more false breakouts |
Donchian: longer period (for example 50) | A wider, flatter channel; fewer breakouts, and each comes later |
Here’s the important part: changing the settings doesn’t make either channel more accurate. It only moves the trade-off between speed and false signals. Pick one setting and keep it long enough to learn how it behaves. Also, stick to the 4-hour and daily charts for clearer readings, because on 1-minute and 5-minute charts, both channels are full of noise.
What are the limits of Keltner and Donchian Channels?
Neither one predicts price. Both describe the past: a Keltner line follows an average and ATR, and a Donchian line follows old highs and lows. Keep these weak spots in mind:
Keltner lags. The basis is an EMA, so it follows price after it moves.
A close outside the Keltner band is not a reversal signal. In strong trends, price can stay outside for a long time.
Donchian lines can move without price moving. When an old high or low leaves the window, the line steps, as the 84,898 high did in the chart above.
One wick can set a Donchian line. A single long wick can hold the line far from where most candles traded.
Breakouts fail often. In sideways markets, price can close outside a Donchian line and fall back inside the range within a few candles.
Neither shows momentum, volume or key levels. Combine them with other tools.
Frequently asked questions
What are the best Keltner Channels settings for crypto?
There’s no single best setting. The default of a 20-period EMA, a 10-period ATR and a multiplier of 2 is a good starting point. A higher multiplier suits very volatile coins, because price then reaches the band less often. Pick one setting and learn how it behaves before adjusting it.
Is a close outside the Keltner Channel a buy or sell signal?
Not on its own. It only shows that price has moved further from its average than usual. In a strong trend, that can be a sign of strength, and price can keep riding the band. In a sideways market, it often falls back. Check the trend, the nearby levels and the candle close before acting.
Why is the Donchian line flat and then suddenly drops?
The upper line shows the highest high of the last N candles. It stays flat as long as that high stays inside the window, and it drops when the high becomes older than N candles. In the BTC/USDT example above, the 84,898 high had left the 20-candle window, so the upper line sat well below it.
Do Donchian Channel breakouts work in crypto?
They describe real moves out of a recent range, but no breakout works every time. Crypto can reverse sharply, and many breakouts fall back into the range. Keep in mind that crypto assets are volatile, and the U.S. SEC notes that the risk of loss remains significant.
Try it yourself
Open the free live crypto charts, add both channels to the 4-hour chart of a pair you follow, and check the last big move: did price leave the Donchian range, and did it also close outside the Keltner band? Then size any trade from your stop with the position size calculator.