RSI and Stochastic answer the question "how strong were the recent moves?" on a scale that stops at 0 and 100. CCI asks something different: how far has the price travelled from its own average, compared with how far it normally travels? Because it has no fixed top or bottom, it can go much further than the other oscillators when a move is large. This guide explains how CCI is calculated, what the +100 and −100 lines mean, and where it misleads, using a real BTC/USDT chart. You can add CCI to any USDT pair on our free live crypto charts.
What is the CCI indicator?
CCI stands for Commodity Channel Index. It was developed by Donald Lambert and published in 1980, originally for commodity markets, and it works on any market with prices, crypto included. It is drawn as one line in its own panel below the chart, usually with a level line above zero and one below.
CCI above zero: the price is above its recent average.
CCI below zero: the price is below its recent average.
CCI far from zero: the price is far from its average, compared with how far it usually strays.
On our chart, the settings are written as CCI(20), a 20-period setting, with a +100 upper level and a −100 lower level.
How is CCI calculated?
CCI has three steps. It starts from the typical price of each candle, the same one used in our guide on what VWAP is in crypto:
Typical price (TP) = (high + low + close) ÷ 3
Then it compares the latest typical price with its average over the period, and divides by how spread out the typical prices have been:
CCI = (TP − average of TP) ÷ (0.015 × mean deviation)
The average of TP is a simple moving average of the typical price. Our guide to moving averages in crypto explains how an SMA is calculated.
The mean deviation is the average distance of the typical prices from that average, ignoring whether each is above or below.
The 0.015 is a constant Lambert chose so that most CCI readings fall between −100 and +100.
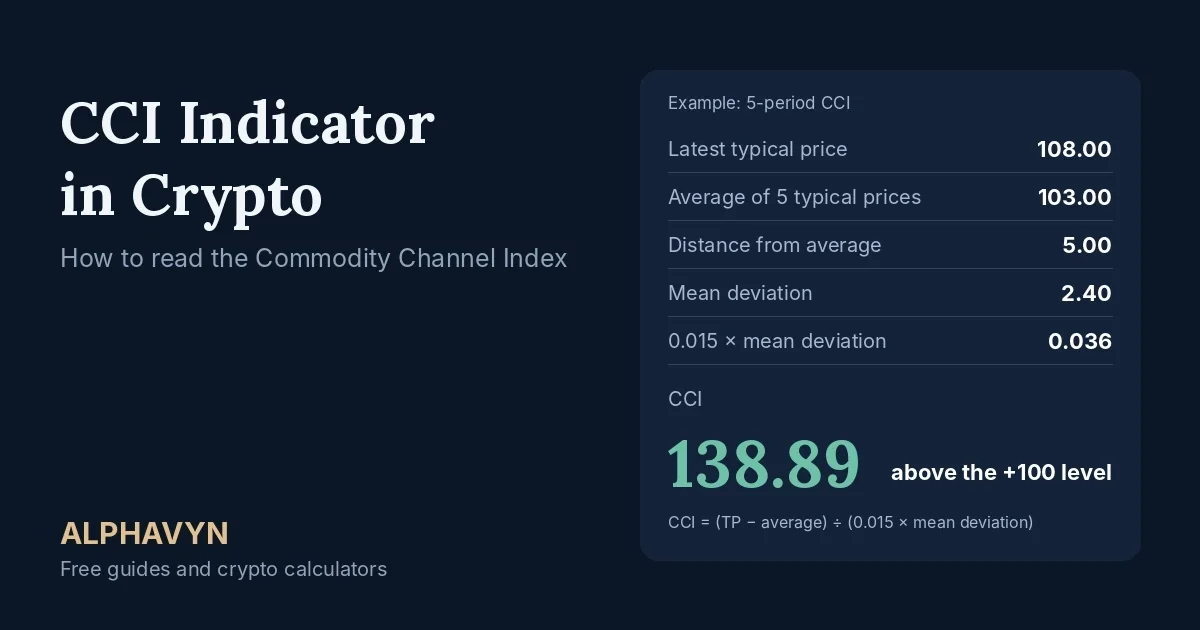
Example: a 5-period version, to keep the numbers short. The last five typical prices were 100, 102, 101, 104 and 108.
Average = (100 + 102 + 101 + 104 + 108) ÷ 5 = 103
Distances from the average: 3, 1, 2, 1 and 5, which add up to 12
Mean deviation = 12 ÷ 5 = 2.4
Latest typical price minus average = 108 − 103 = 5
CCI = 5 ÷ (0.015 × 2.4) = 5 ÷ 0.036 = 138.89
The price is 5 above its average, and a normal distance in this example is 2.4, so CCI reads above +100. Your chart does all of this automatically for every candle.
How is CCI different from standard deviation in Bollinger Bands?
Both measure how spread out prices are, but in different ways. Bollinger Bands use the standard deviation of closing prices, which gives extra weight to large distances. CCI uses the mean deviation, the plain average of the distances. Our guide to Bollinger Bands in crypto explains standard deviation step by step.
Why does CCI have no fixed top or bottom?
RSI and Stochastic are squeezed into a range from 0 to 100, so they cannot go beyond it. CCI is not. It divides the distance from the average by the usual spread, so if the price moves much further than usual, CCI keeps rising.
Example: with the same distance of 5 above the average, a calm market with a mean deviation of 2.4 gives CCI = 138.89. A volatile market with a mean deviation of 4.8 gives CCI = 5 ÷ (0.015 × 4.8) = 69.44.
The same 5-point move reads as a big move in the calm market and an ordinary one in the volatile market. That is why CCI is measured against the usual spread and not in price units, and why you can compare its readings across coins with very different prices, unlike MACD.
What do the +100 and −100 levels mean?
The levels show how unusual the current distance from the average is:
CCI reading | A common reading |
|---|---|
Above +100 | The price is unusually far above its average |
0 to +100 | The price is above its average, within the usual range |
−100 to 0 | The price is below its average, within the usual range |
Below −100 | The price is unusually far below its average |
Lambert's original idea was that a reading above +100 could mark the start of a strong move, not just a stretched one. Many traders use it both ways, depending on the market, as the next sections explain. As with RSI, the names overbought and oversold are misleading: a high CCI only means the price has moved far from its average, and in a strong trend it can keep going. Our guide on how to use RSI in crypto explains why, and our guide to Stochastic vs Stochastic RSI covers the other common momentum oscillator.
How do I read CCI on the ALPHAVYN chart?
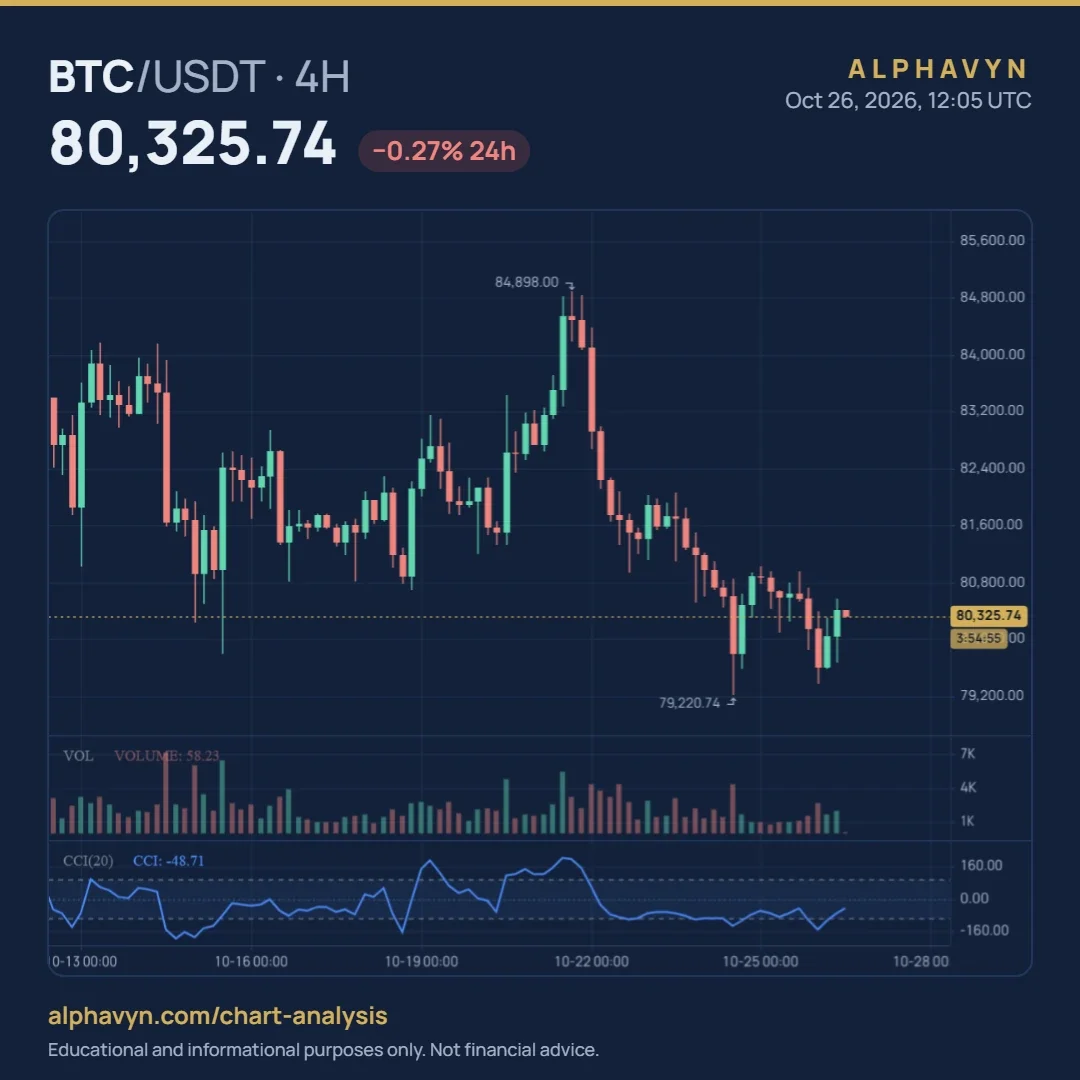
Here is CCI on the BTC/USDT 4-hour chart at 12:05 UTC on 26 October 2026, with the price at 80,325.74. The label reads:
CCI(20) CCI: −48.71
Reading it step by step:
CCI is below zero. At −48.71, the price is below its recent average. The reading is mildly weak, not extreme.
CCI is inside the ±100 band. It is 48.71 below the zero line and 51.29 above the −100 line, so the price is not unusually far from its average.
The price is above the labeled low and far below the labeled high. At 80,325.74, BTC is 1,105.00 above the 79,220.74 low and 4,572.26 below the 84,898 high.
The panel also shows how CCI behaved over the previous two weeks:
A drop below −100 in mid-October. After a fall, CCI went well below the lower level, then climbed back toward zero and stayed below it for several days while the price moved sideways.
A rise above +100 with the rally. As the price rallied toward 84,898, CCI climbed well above the upper level and stayed there for a while. It peaked around the same time as the price high.
A fall through zero and below −100 afterward. When the price turned down from the 84,898 high, CCI fell back through zero and below the lower level.
Mostly between −100 and zero since. In the last few days, CCI has mostly stayed below zero, near or just inside the lower level, with a brief dip beneath it.
The chart also shows what a reading above +100 meant in practice. During the rally, CCI stayed above the upper level for many candles while the price kept rising, so a reading above +100 was a sign of strength, not an early sell signal. It was only after CCI fell back below the level, and then below zero, that the price turned down.
You can change the period and the two levels in the indicator settings, and hide the level lines if you prefer.
How do traders use CCI?
As a strength filter in a trend. A CCI that holds above +100 shows the price staying unusually far above its average, which many traders read as a strong uptrend. A CCI that stays below −100 shows the same in a downtrend. Our guide to the ADX indicator in crypto explains another way to measure how strong a trend is.
For the zero line. CCI crossing above zero means the price has moved above its average; crossing below means it has fallen below it. It is similar in spirit to a price crossing a moving average, and it lags in the same way.
For reversals in a range. In a sideways market, a CCI above +100 that turns back down, or below −100 that turns back up, can show a stretch that is easing. Our beginner's guide to support and resistance explains why a reading at a well-tested level carries more weight than one in the middle of nowhere.
For divergence. If the price makes a new high but CCI makes a lower high, momentum is weaker than the price suggests, just like RSI divergence. It is a warning, not a timing signal, as our guide on how to use RSI in crypto explains.
With candles. A candle closing back inside a level, after CCI has left it, confirms more than the line alone. Our guide on how to read crypto candlestick charts explains why the close matters more than the wick.
Whatever CCI shows, the trade still needs a stop loss where the idea would be wrong, and a position sized so the stop costs only what you chose to risk, using the position size calculator.
How is CCI different from RSI and Stochastic?
CCI | RSI | Stochastic | |
|---|---|---|---|
Measures | Distance of the typical price from its average, against the usual spread | Recent gains compared with recent losses | Where the close sits in its recent high-low range |
Range | No fixed top or bottom | 0 to 100 | 0 to 100 |
Usual levels | +100 and −100 | 70 and 30 | 80 and 20 |
Zero or middle | 0 | 50 | 50 |
Built from | Typical price (high, low and close) | Closing prices | Close, high and low |
Because CCI can go beyond its levels, a reading of +250 means something very different from +105, while RSI cannot show that difference once it passes 90. Many traders use CCI with one other indicator, for example RSI, and look for agreement.
Should I change the CCI settings?
The settings on our chart are period 20, upper level +100 and lower level −100, with the level lines switched on. They are a good place to start. Here is what changing them does:
Change | Effect |
|---|---|
Shorter period (for example 10) | CCI reacts faster and crosses the levels more often, with more false readings |
Longer period (for example 50) | CCI is smoother and slower, with fewer crossings |
Wider levels (for example +200 and −200) | Only the largest moves count, so crossings are rarer |
Narrower levels (for example +50 and −50) | Crossings are more frequent and carry less meaning |
Changing the settings doesn't make CCI more accurate. It moves the trade-off between speed and false signals. Keep the same settings long enough to learn how they behave, and use the 4-hour and daily charts for clearer readings; on 1-minute and 5-minute charts, CCI swings constantly.
What are the limits of CCI?
It can stay beyond ±100 for a long time. In a strong trend, a reading above +100 or below −100 can last many candles, as in the rally above.
It has no fixed scale. A reading of +100 means different things in a calm and a volatile market, and there is no 0 to 100 range to compare against.
It lags. It uses an average of recent prices, so it follows the price after it moves.
It whipsaws in sideways markets. When the price moves back and forth, CCI crosses zero and the levels again and again.
One large candle can distort it. A single very large candle changes both the average and the spread for the whole period.
It shows momentum only. It says nothing about volume, support and resistance, or the trend direction beyond the average.
Frequently asked questions
What is a good CCI value?
There isn't one. CCI is read against its levels, usually +100 and −100, and against zero. Above +100 means the price is unusually far above its average, and below −100 means it is unusually far below. These are guidelines, not rules.
What are the best CCI settings for crypto?
There's no single best setting. The default of a 20-period CCI with +100 and −100 levels is a good starting point. A shorter period reacts faster with more false readings; a longer one is smoother but slower. Pick one setting and learn how it behaves before adjusting it.
Is CCI above +100 a sell signal?
Not on its own. A reading above +100 only shows the price is unusually far above its average. In a strong uptrend, CCI can stay above it for a long time while the price keeps rising. Many traders look for more evidence first, such as the price stalling at resistance, a bearish divergence, or a candle closing below a key level.
Is CCI reliable in crypto?
It's a useful way to see how stretched the price is from its average, but no indicator is reliable on its own. CCI lags the price and gives many false signals in sideways markets. Crypto assets are volatile, and the U.S. SEC notes that the risk of loss remains significant.
Open the free live crypto charts, add CCI to the 4-hour chart of a pair you follow, and look at the last big move: how long did CCI stay above +100 or below −100, and where did the price go next? Then size any trade from your stop with the position size calculator.