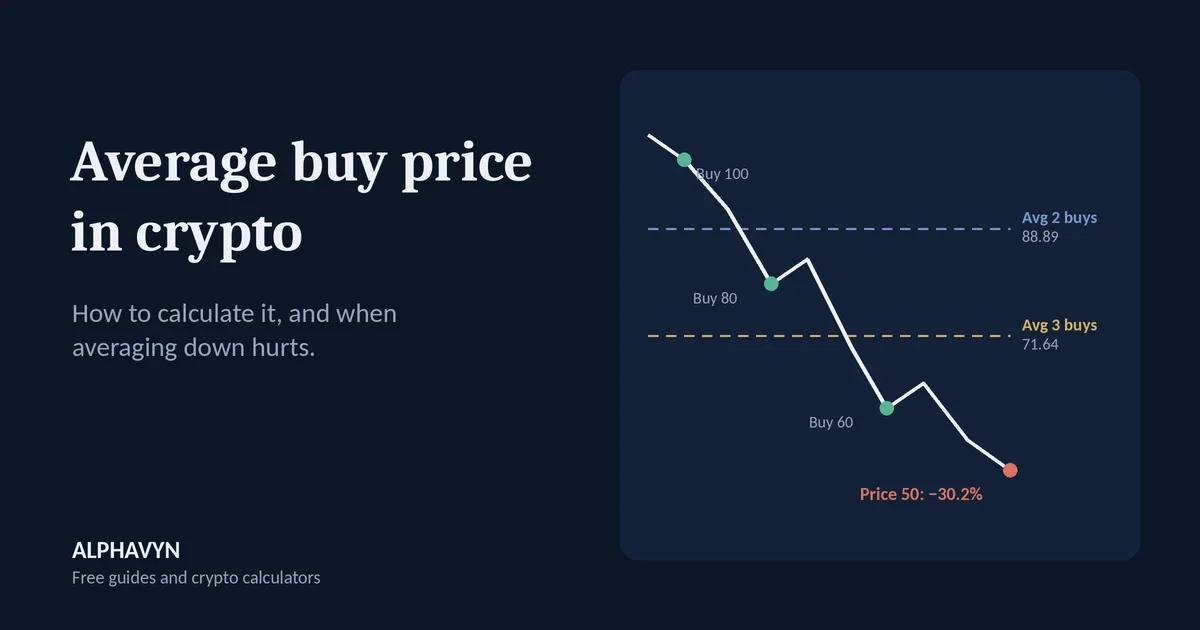
If you bought the same coin more than once at different prices, your real entry is not any single one of those prices. It is your average buy price, and it decides where you are in profit, where you break even, and how much you lose if the price keeps falling. This guide shows how to calculate it and when buying more to lower it can backfire. You can follow every example in the free average price calculator.
What is the average buy price?
Your average buy price is the price you effectively paid per coin across all your buys. If the current price is above it, your position is in profit; if it is below, the position is in loss.
It matters most when you build a position in steps, for example buying some now and some later, or buying more after a drop.
How do I calculate the average buy price?
Average buy price = total USDT spent ÷ total coins bought
To get the coins for each buy: coins = USDT spent ÷ price.
This is a weighted average. A simple average of the prices only works if you spent the same amount at each price and bought the same number of coins each time, which almost never happens. Buys where you bought more coins pull the average more strongly toward their price.
A worked example with two buys
You buy 500 USDT at 100, then another 500 USDT after the price drops to 80.
Buy | USDT spent | Price | Coins |
|---|---|---|---|
1 | 500 | 100 | 5.00 |
2 | 500 | 80 | 6.25 |
Total | 1,000 | 11.25 |
Average buy price = 1,000 ÷ 11.25 = 88.89
Notice that the average is not 90, the midpoint of 100 and 80. Because 500 USDT buys more coins at 80, the average is pulled closer to the lower price.
If the price recovers to 95, the position is worth 11.25 × 95 = 1,068.75 USDT, a profit of +6.9% on 1,000 USDT, even though the price is still below the first buy at 100.
What happens when I average down?
Averaging down means buying more after the price falls, to lower your average buy price.
Continue the example. The price falls to 60, and you buy another 1,000 USDT:
Buy | USDT spent | Price | Coins |
|---|---|---|---|
1 | 500 | 100 | 5.00 |
2 | 500 | 80 | 6.25 |
3 | 1,000 | 60 | 16.67 |
Total | 2,000 | 27.92 |
Average buy price = 2,000 ÷ 27.92 = 71.64
The average dropped from 88.89 to 71.64. If the price bounces back above 71.64, the whole position is in profit, much sooner than if you had stopped at two buys.
That is why averaging down feels attractive. The next section shows the other side.
When can averaging down hurt?
Suppose the price does not bounce, and falls further to 50.
Two buys only | After averaging down | |
|---|---|---|
Money put in | 1,000 USDT | 2,000 USDT |
Average buy price | 88.89 | 71.64 |
Value at 50 | 562.50 USDT | 1,395.83 USDT |
Loss in USDT | −437.50 | −604.17 |
Loss in % | −43.8% | −30.2% |
Rise needed to break even | +77.8% | +43.3% |
The percentage loss looks smaller after averaging down, but the loss in USDT is larger: 604.17 instead of 437.50. Averaging down doubled the money at risk, from 1,000 to 2,000 USDT, in a coin that kept falling.
This is the trap. A lower average makes recovery look closer, but if the coin keeps falling, every extra buy adds to the loss. Coins can fall a long way and stay down. Crypto assets are volatile, and the U.S. SEC notes that the risk of loss remains significant.
Averaging down also tends to break a trade plan. If the original idea had a stop loss below 80, buying more at 60 means the stop was ignored. Our guide on where to place a stop loss in crypto explains why a stop that moves or disappears turns a planned loss into an unplanned one.
Averaging down vs planned DCA: what is the difference?
Both involve buying at different prices, but the decision behind them is different:
Planned DCA | Averaging down | |
|---|---|---|
When you buy | On a fixed schedule | After the price falls |
Amount | Fixed, decided in advance | Often grows with each drop |
Total money | Known from the start | Can keep growing |
Main risk | Buying through a long decline | Adding more and more to a losing position |
DCA is a plan made before the first buy. Averaging down is often a reaction to a loss. Our test of Bitcoin DCA daily vs weekly vs monthly shows how a planned schedule played out over three years of real prices.
If you want to add to a position in steps, decide the levels, amounts and the maximum total in advance, and size everything so the total loss at your stop is still an amount you accept.
How do I use the free average price calculator?
The average price calculator works out your average entry, total coins and profit or loss across several buys. To try the two-buy example from this article:
Under Your buys, enter 100 as the Price and 500 as Spent (USDT).
Click Add a buy and enter 80 and 500.
Enter 95 as the Current price (optional).
The calculator shows an average price of 88.8889, 11.25 total coins, 1,000.00 USDT total spent, and a profit of +68.75 USDT (+6.9%). Add a third buy of 1,000 at 60 to see the average drop to about 71.64.
Fees are not included, so your breakeven price before fees equals your average price.
Frequently asked questions
Does averaging down guarantee breaking even?
No. It only lowers the price you need to get back to. If the coin keeps falling or never recovers to your new average, the position stays in loss, and because you added more money, the loss in USDT can be larger than before.
Are fees included in the average price?
Not in the basic formula. To include them, add the fees you paid to the total spent, or subtract fees taken in coins from the total coins. The result is a slightly higher average, which is your true breakeven before the exit fee. Our guide on how to calculate crypto profit after fees explains how fees on both sides affect your result.
How many buys should I plan?
There is no fixed number. What matters is that the number of buys, the price levels, the amounts and the maximum total are decided before the first buy, not after each drop. Size the plan so that, if your stop loss is reached, the total loss across all buys is still within the amount you chose to risk.
Does the average change when I sell part of my position?
No. Selling part of a position reduces the number of coins you hold, but the average buy price of the remaining coins stays the same. Only new buys change the average.
Track your entries in the free average price calculator so you always know your real average and where you break even.