At first sight, Ichimoku looks like the busiest indicator on any chart: five lines and a colored cloud, all on top of the candles. But each line answers a simple question, and together they show the trend, its strength and the nearby support and resistance in one view. The name, ichimoku kinko hyo, roughly means “one-glance equilibrium chart”. This guide explains what each line measures, how to read the cloud, and how to combine them, using a real BTC/USDT chart. You can add Ichimoku to any USDT pair on our free live crypto charts.
What is the Ichimoku Cloud?
Ichimoku was developed by the Japanese journalist Goichi Hosoda and published in the late 1960s. It’s a set of five lines drawn on the price chart:
Line | Also called | Color on our chart | What it shows |
|---|---|---|---|
Conversion line | Tenkan-sen | Blue | The short-term balance of price |
Base line | Kijun-sen | Red | The medium-term balance of price |
Span A | Senkou Span A | Green | One edge of the cloud |
Span B | Senkou Span B | Purple | The other edge of the cloud |
Lagging line | Chikou Span | Grey | Today’s close, drawn back in time |
The space between Span A and Span B is filled in and called the cloud, or kumo. The standard settings are written as Ichimoku (9, 26, 52).
How is each line calculated?
Unlike a moving average, most Ichimoku lines use the midpoint of a range: the highest high plus the lowest low, divided by two.
Conversion line = (highest high + lowest low of the last 9 candles) ÷ 2
Base line = (highest high + lowest low of the last 26 candles) ÷ 2
Span A = (conversion line + base line) ÷ 2, drawn ahead of the price
Span B = (highest high + lowest low of the last 52 candles) ÷ 2, drawn ahead of the price
Lagging line = the latest close, drawn back behind the price
Example: over the last 9 candles, the highest high was 84,000 and the lowest low was 82,551.
Conversion line = (84,000 + 82,551) ÷ 2 = 83,275.50
Because the lines use midpoints, they stay flat while the price moves inside the range, and they only move when a new high or low enters the period. That’s why Ichimoku lines often look like steps rather than smooth curves.
Why is the cloud drawn ahead of the price?
Span A and Span B are shifted forward. With the standard settings on our chart, the cloud is drawn 25 candles ahead of the last candle. So the cloud you see above the latest candle was calculated 25 candles ago, and the cloud to the right of the latest candle shows the levels the price will meet in the coming candles.
That’s what makes Ichimoku different from most indicators: part of it sits in the future. It isn’t a prediction. It simply places today’s calculation where the price will be later, so you can see where support or resistance from the cloud will be.
What does the cloud tell you?
The cloud is read in two ways: where the price is compared with it, and what color it is.
Where the price is:
Above the cloud: the price is above both spans, a sign of an uptrend.
Below the cloud: the price is below both spans, a sign of a downtrend.
Inside the cloud: the price is between the spans, a sign of no clear trend.
The color:
Green cloud: Span A is above Span B. Shorter-term midpoints are above longer-term ones, which leans bullish.
Red cloud: Span A is below Span B, which leans bearish.
The thickness: a thick cloud means the spans are far apart, so it tends to act as stronger support or resistance. A thin cloud is easier for the price to break through.
What do the conversion and base lines show?
The conversion line reacts faster, because it looks back only 9 candles. The base line looks back 26 candles and moves more slowly.
When the conversion line is above the base line, short-term prices are above the medium-term balance, which leans bullish.
When it’s below the base line, it leans bearish.
A cross between the two is one of the most watched Ichimoku events, much like a moving average crossover.
A cross means more when it agrees with the cloud. A bullish cross with the price above a green cloud is stronger than one that happens below a red cloud. The base line itself is also often watched as support in an uptrend or resistance in a downtrend.
What does the lagging line show?
The lagging line takes each candle’s close and draws it back, behind the price. It lets you compare today’s close with the price from the past:
When the lagging line is above the old prices it sits next to, today’s close is higher than it was then, which leans bullish.
When it’s below them, it leans bearish.
Because the line is drawn back, it has no value at the latest candle. That’s why the label on our chart shows Lagging: n/a at the most recent candle. The line itself is visible further to the left.
How do I read Ichimoku on the ALPHAVYN chart?
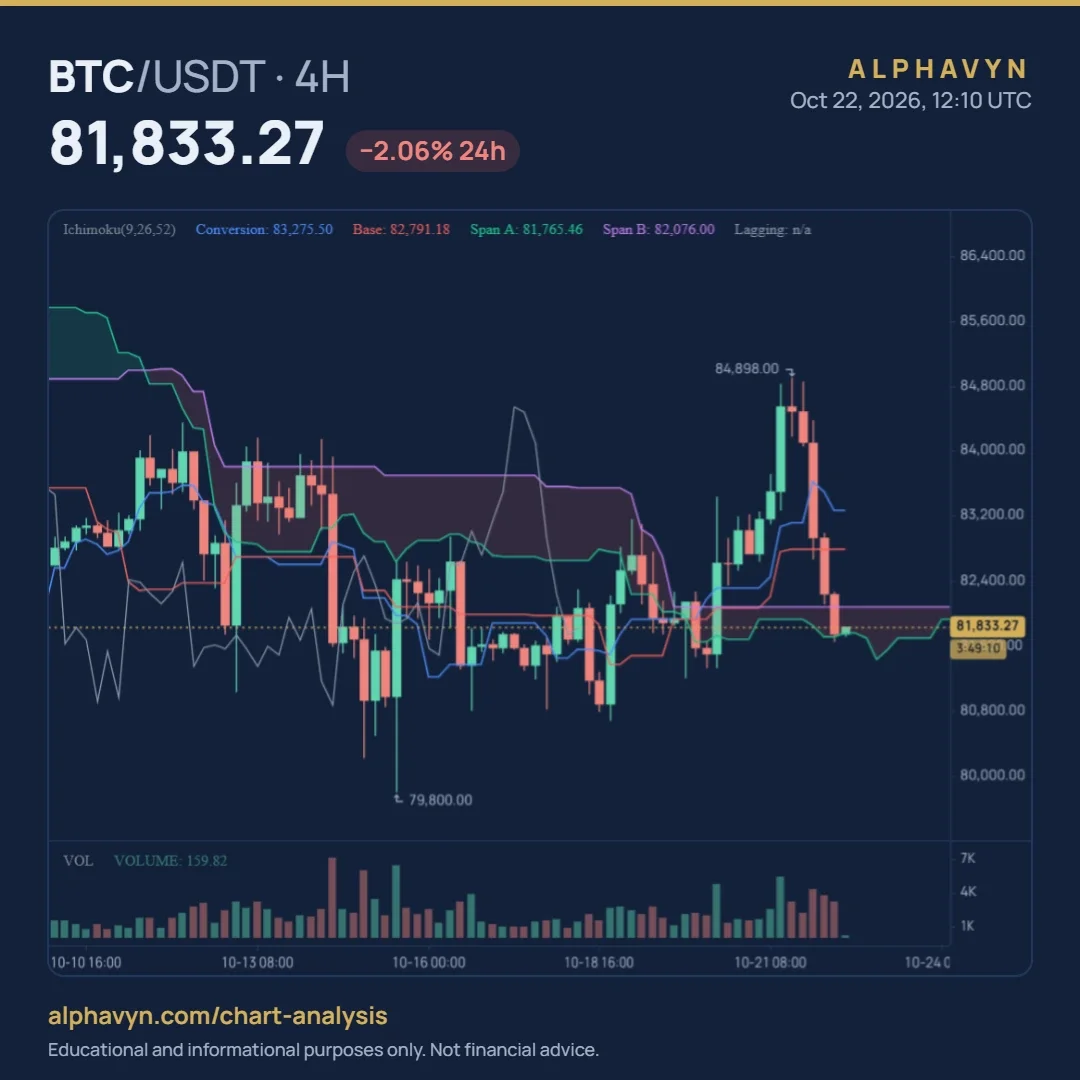
Here is Ichimoku on the BTC/USDT 4-hour chart at 12:10 UTC on 22 October 2026, with the price at 81,833.27. The label reads:
Ichimoku(9,26,52) Conversion: 83,275.50 Base: 82,791.18 Span A: 81,765.46 Span B: 82,076.00 Lagging: n/a
Reading it step by step:
The price is inside the cloud. At 81,833.27, it sits between Span A at 81,765.46 and Span B at 82,076.00. Ichimoku shows no clear trend right now.
The cloud at the latest candle is red. Span A is below Span B.
The price is below both the conversion and base lines. After the drop from 84,898, the price fell under the conversion line (83,275.50) and the base line (82,791.18).
The conversion line is still above the base line. The faster line hasn’t crossed below the slower one yet.
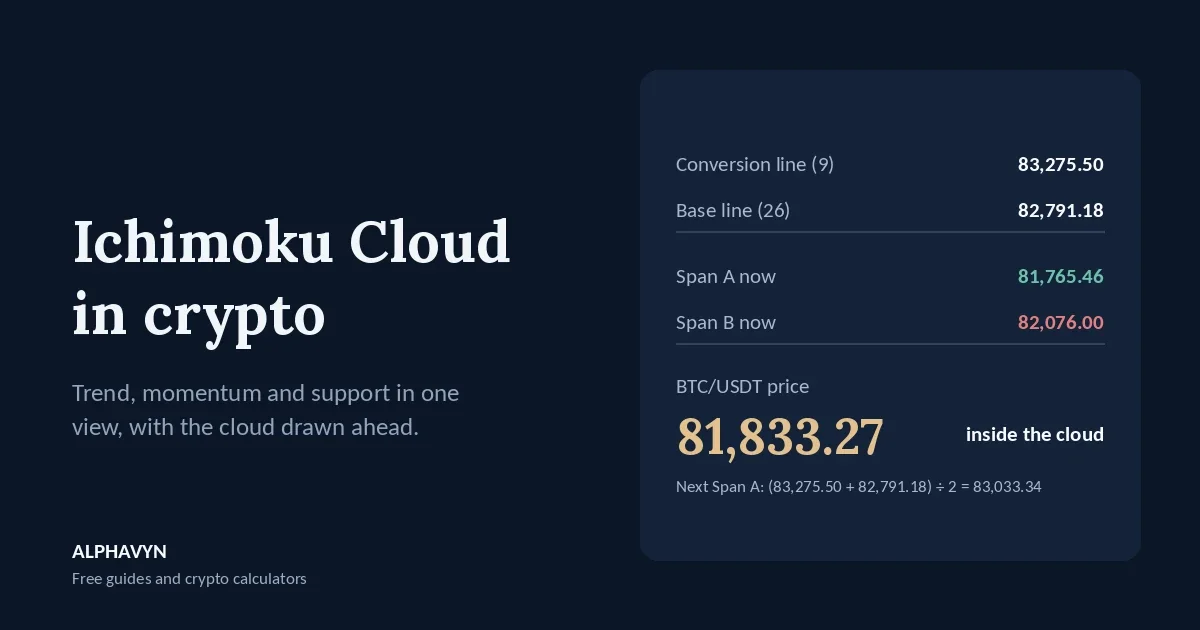
The Span A value in the label, 81,765.46, isn’t the average of today’s conversion and base lines. It was calculated 25 candles ago and drawn forward to today. Today’s average, (83,275.50 + 82,791.18) ÷ 2 = 83,033.34, will appear as Span A 25 candles from now.
The chart also shows how Ichimoku tracked the last two weeks:
Below a red cloud. From about 13 to 19 October, the cloud was red and the price spent most of the time below it, matching the weak price action of that period.
A break above, then a return. On 20 and 21 October, the price rose above a thinning cloud and reached 84,898. By 22 October, it had fallen back into the cloud.
You can change the conversion, base and Span B periods from the default 9, 26 and 52 in the indicator settings.
How do traders use Ichimoku?
Many traders read Ichimoku as a checklist. For a bullish reading, all of these would agree:
The price is above the cloud.
The cloud ahead is green.
The conversion line is above the base line.
The lagging line is above the price from the past.
For a bearish reading, all four are reversed. When the lines disagree, as in the BTC/USDT example, the picture is mixed, and many traders wait.
The cloud and the base line are also used as levels. In an uptrend, pullbacks often stop near the top of the cloud or the base line. A clear close below the cloud can show the trend has weakened. Our guide on how to read crypto candlestick charts explains why the close matters more than the wick.
Whatever Ichimoku shows, the trade still needs a stop loss where the idea would be wrong, and a position sized so the stop costs only what you chose to risk. Our guide on where to place a stop loss in crypto covers how to choose a level, and the position size calculator does the sizing.
Should I change the Ichimoku settings?
The standard 9, 26 and 52 were designed decades ago for markets that traded six days a week. Crypto trades every day, so some traders adjust the numbers, for example using longer periods. There’s no single agreed crypto version, though, and the standard settings remain the most widely watched.
Shorter periods make the lines react faster, with more false signals.
Longer periods make them slower and smoother.
Changing the settings doesn’t make Ichimoku more accurate. If you change them, keep the new values long enough to learn how they behave.
What are the limits of Ichimoku?
It works best in trends. In sideways markets, the price moves in and out of the cloud, and the lines cross back and forth.
It lags. The lines are built from past highs and lows, so they confirm moves after they start.
The cloud ahead isn’t a forecast. It shows levels calculated from past prices, not where the price will go.
It’s crowded. Five lines can hide the candles. Many traders turn some lines off once they’re familiar with them.
How does Ichimoku compare with moving averages?
Both show the trend, but in different ways. Moving averages smooth closing prices; Ichimoku uses midpoints of highs and lows, adds a cloud drawn ahead, and combines several timeframes in one indicator. Our guide to moving averages in crypto explains the moving average side, and our beginner’s guide to support and resistance explains how horizontal levels work alongside the cloud.
Frequently asked questions
What does it mean when the price is inside the Ichimoku cloud?
The price is between Span A and Span B, so Ichimoku shows no clear trend. Many traders wait for a clear close above or below the cloud before reading a direction.
What is the difference between a green and a red cloud?
A green cloud means Span A is above Span B, which leans bullish. A red cloud means Span A is below Span B, which leans bearish. The color can change ahead of the price, showing the balance shifting in the coming candles.
Why does the lagging line show n/a?
The lagging line draws each close back behind the price, so there’s no value at the latest candle. You can see the line further left on the chart.
Are the Ichimoku settings different for crypto?
The standard 9, 26 and 52 are the most widely used, including in crypto. Some traders use longer settings because crypto trades every day, but there’s no single agreed alternative. Crypto assets are volatile, and the U.S. SEC notes that the risk of loss remains significant.
Open the free live crypto charts, add Ichimoku to the 4-hour chart of a pair you follow, and check the four-step checklist: where the price is against the cloud, the cloud’s color ahead, the conversion and base lines, and the lagging line.