Support and resistance are among the first ideas most traders learn, and for good reason. They help you decide where to enter, where to place a stop loss, and where to take profit. This guide explains what they are, how to find them on a chart, and the mistakes that trip up beginners. To check the structure of any USDT pair quickly, you can use the free pair analyzer.
What are support and resistance?
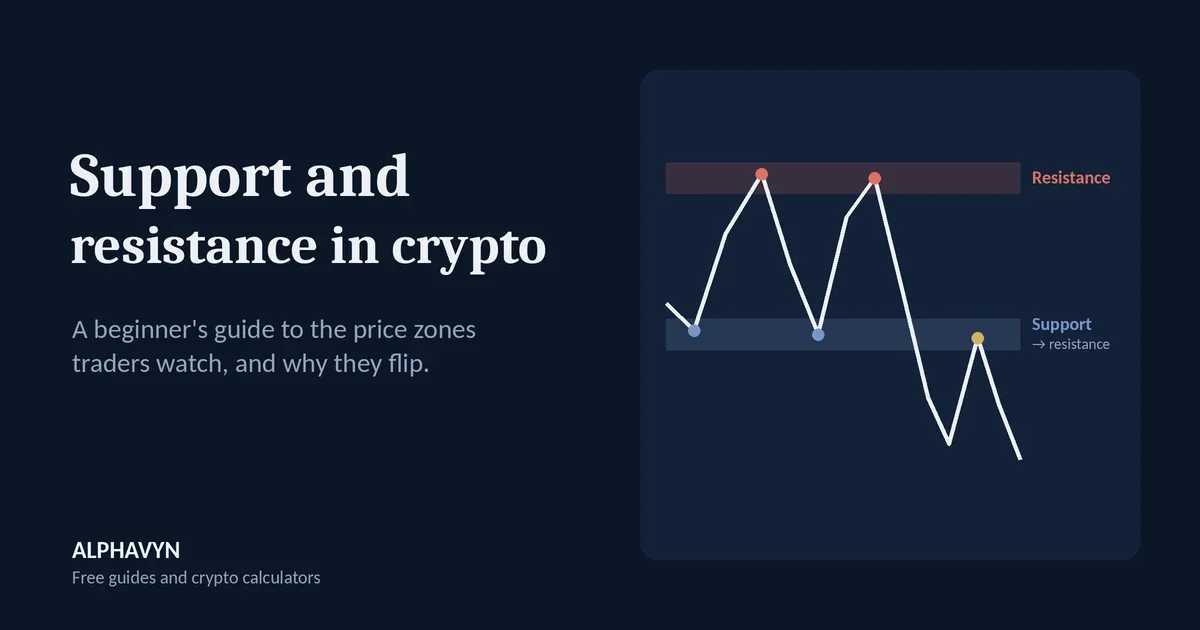
Support is a price area where a falling price has stopped and bounced before. At that level, buyers stepped in strongly enough to stop the decline.
Resistance is a price area where a rising price has stopped and turned down before. At that level, sellers were strong enough to stop the rise.
Imagine a coin that fell to around 2,200 three times in a month and bounced each time. That area is support. If the same coin climbed to around 2,400 twice and fell back each time, that area is resistance. Between them, the price is moving in a range.
Why do these levels work?
Support and resistance are not magic. They work when they do, because of how people behave around prices they remember.
Many traders watch the same prices. If thousands of traders see the same bounce at 2,200, many will place buy orders near it next time, which can create another bounce.
Traders remember their own trades. Someone who bought at 2,400 and watched the price fall may sell as soon as it returns to 2,400, just to get out without a loss. That selling creates resistance.
Previous reactions show where orders were. A sharp bounce shows that a lot of buying was waiting at that level, and some of it may still be there.
Because they depend on behavior, levels can and do break. They show where a reaction is more likely, not where it is guaranteed.
How do I find support and resistance on a chart?
Start with a clean chart, a daily timeframe, and these three sources of levels:
1. Swing highs and swing lows. A swing low is the bottom of a pullback before the price turned up; a swing high is the top of a rally before it turned down. Several swing lows at a similar price form support; several swing highs at a similar price form resistance. The more times a level has been tested, the more traders notice it.
2. Round numbers. Prices like 1.00, 100, or 50,000 attract attention because people naturally set orders at round numbers. They often act as support or resistance even without a past reaction.
3. Previous ranges. If a coin moved sideways between two prices for weeks, the top and bottom of that range often matter again later, even after the price has left it.
Mark only the levels that stand out clearly. If you have to search hard for a level, the market probably is not watching it either.
Why are support and resistance zones, not exact lines?
Price rarely turns at exactly the same number twice. One bounce may start at 2,195, the next at 2,212, another at 2,188. Drawing a single line at 2,200 makes it look as if the level "failed" every time the price dips a little below it.
It is more useful to think of a zone, for example 2,180 to 2,220. A zone accepts that orders are spread out around a level and that prices overshoot slightly before reacting. On volatile coins, zones are usually wider.
You can draw your own support and resistance zones with horizontal lines and rectangle zones on our free live crypto charts.
What happens when support breaks?
When the price falls clearly through support and stays below it, that level often changes role and acts as resistance later. This is sometimes called a role reversal or "flip."
A useful way to judge a clear break is to look at where candles close, not just where their wicks reach. Our guide on how to read crypto candlestick charts explains why a wick below support with a close above it often means the level held.
Here is why. Traders who bought at support are now in a loss. When the price climbs back to their entry, many sell to break even, which creates selling pressure exactly where buying used to be.
The same works in reverse: when resistance breaks, and the price holds above it, the old resistance often becomes support.
Example: support at 2,200 held three times. Then the price broke below it and fell to 2,050. A few days later it rallied back to 2,200, stalled, and fell again. The old support had become resistance.
How do I use levels for entries and stop losses?
Support and resistance connect the main parts of a trade plan:
Entry: a Long near support, or a Short near resistance, means your stop loss can sit close, just beyond the level.
Stop loss: place it just beyond the zone, where a break would show the idea was wrong. In the example above, a Long near 2,200 support could use a stop around 2,180, below the zone. Our guide on where to place a stop loss in crypto covers this method in detail, with the risk worked out.
Targets: the next level in the direction of the trade is a natural target. For a Long from support at 2,200, resistance near 2,400 could be TP1 or TP2.
Once the entry and stop are set, size the position so the stop costs only what you chose to risk, using the position size calculator. Our guide on how to plan a crypto trade puts all the parts together.
How does the ALPHAVYN pair analyzer help?
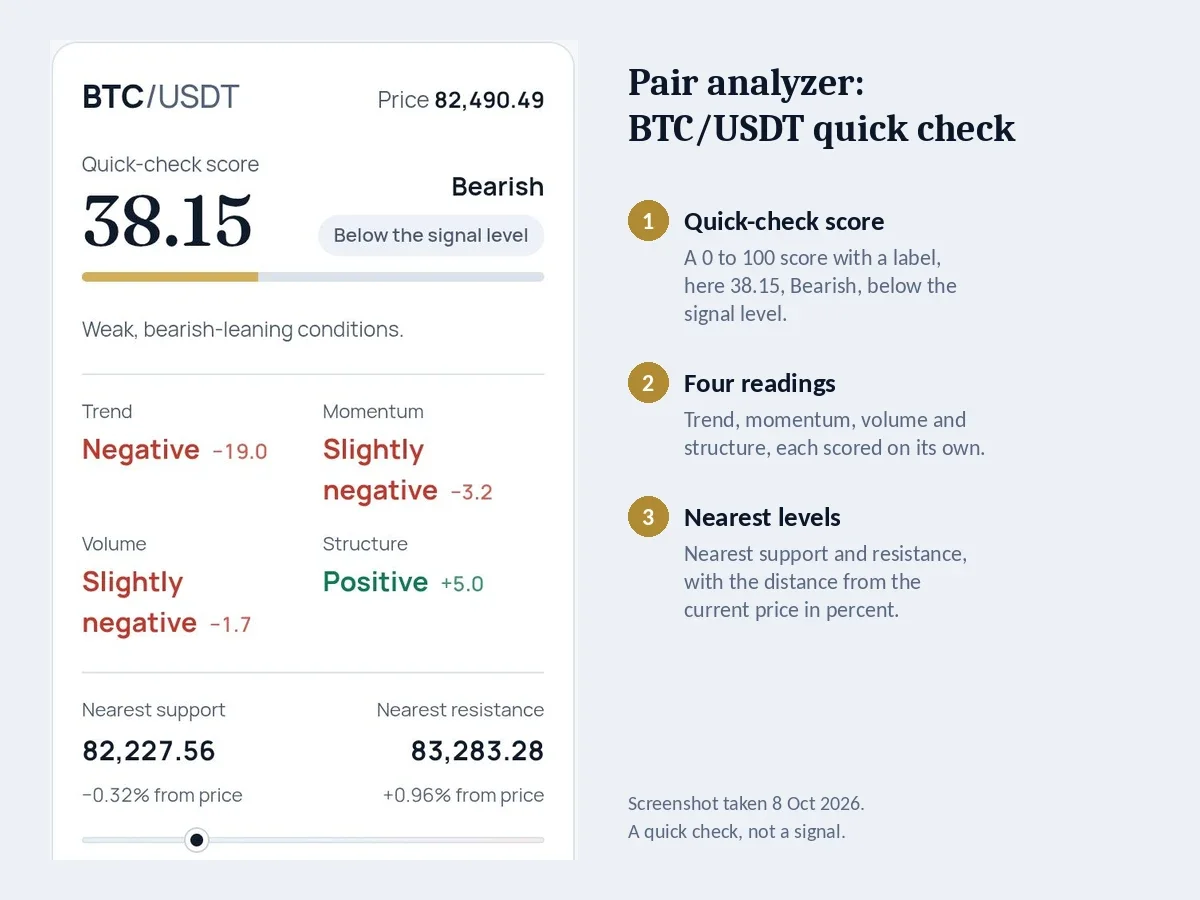
The pair analyzer gives a quick reading for any USDT pair. Type a pair such as BTC/USDT, and it shows a quick-check score with a label, four separate readings for trend, momentum, volume and structure, and the nearest support and resistance with their distance from the current price.
For example, on 8 October 2026 the BTC/USDT check showed a price of 82,490.49, nearest support at 82,227.56 (0.32% below the price) and nearest resistance at 83,283.28 (0.96% above it). The score was 38.15, labeled Bearish and below the signal level.
These nearest levels are close to the current price, so they are most useful for short-term planning. For bigger trades, compare them with the major zones on the daily chart. The analyzer is a quick check, not a signal: use it to see where the closest levels are, then confirm them on the chart before planning a trade.
The analyzer also shows strong daily support and resistance further from the price. Our guide to trend, momentum, volume and structure walks through a full reading.
What are common mistakes with support and resistance?
Drawing too many lines. A chart covered in levels shows a "level" everywhere, which means none of them help. Keep the few that stand out.
Ignoring the higher timeframe. A support on a 15-minute chart means little if the price is sitting right under major daily resistance. Check the daily chart first.
Expecting exact prices. Treat levels as zones and expect small overshoots.
Assuming a level will always hold. Every level breaks eventually. That is why a stop loss beyond the zone is part of the plan.
Chasing after a break. Buying the moment price pops above resistance often means buying the top of a quick spike. Many traders wait to see if the level holds as support.
Frequently asked questions
Which timeframe is best for support and resistance?
Many traders start with the daily chart, because daily levels are watched by the most people and filter out short-term noise. Shorter timeframes can then help fine-tune an entry within a daily zone.
Do support and resistance work for small altcoins?
They can, but they are less reliable. Small coins with low trading volume can move through levels easily because a few large orders shift the price a lot. Zones on small coins are usually wider, and levels break more often. Crypto assets are volatile, and the U.S. SEC notes that the risk of loss remains significant.
What is the difference between support and a stop loss?
Support is an area on the chart where buyers have stepped in before. A stop loss is the price where you exit a trade. They are related, because a stop is often placed just below support, but they are not the same: support describes the market, while a stop loss is your decision.
Can support and resistance be diagonal?
Yes. A trend line connecting rising swing lows can act as support in an uptrend, and a line connecting falling swing highs can act as resistance in a downtrend. Horizontal levels are easier for beginners to spot and are a good place to start.
Before your next trade, check the pair in the free pair analyzer, then mark the nearest support and resistance zones on the daily chart.
Are pivot points the same as support and resistance?
Pivot points are support and resistance levels calculated from a formula instead of drawn by hand. Our guide to pivot points in crypto explains how they’re calculated.