Crypto prices zigzag constantly, and on a busy chart it can be hard to tell whether a coin is rising, falling or just moving sideways. A moving average solves that by turning the zigzag into one smooth line. It’s one of the oldest tools in trading, and still one of the most watched. This guide explains how the four common types of moving average are calculated, which lengths traders use, what crossovers mean, and where moving averages fail. You can add them to any USDT pair on our free live crypto charts.
What is a moving average?
A moving average is the average closing price over a set number of candles, recalculated each time a new candle closes. As old candles drop off and new ones are added, the average “moves” along with the price.
The result is a line that follows the price but ignores most of the short-term noise. On a daily chart, a 50-period moving average is the average close of the last 50 days. On a 4-hour chart, it’s the average of the last 50 four-hour candles.
Our guide to trend, momentum, volume and structure shows how moving averages are used to read the trend alongside the other readings.
How is a simple moving average (SMA) calculated?
The simple moving average adds up the last closes and divides by how many there are. Every close counts equally.
Example: a 5-period SMA. The last five closes were 100, 102, 101, 104 and 108.
SMA = (100 + 102 + 101 + 104 + 108) ÷ 5 = 515 ÷ 5 = 103
Then a new candle closes at 110. The oldest close, 100, drops out:
SMA = (102 + 101 + 104 + 108 + 110) ÷ 5 = 525 ÷ 5 = 105
How is an exponential moving average (EMA) calculated?
The exponential moving average gives more weight to the most recent close, so it reacts faster to new prices. It uses a multiplier based on the period:
Multiplier = 2 ÷ (period + 1)
EMA = new close × multiplier + previous EMA × (1 − multiplier)
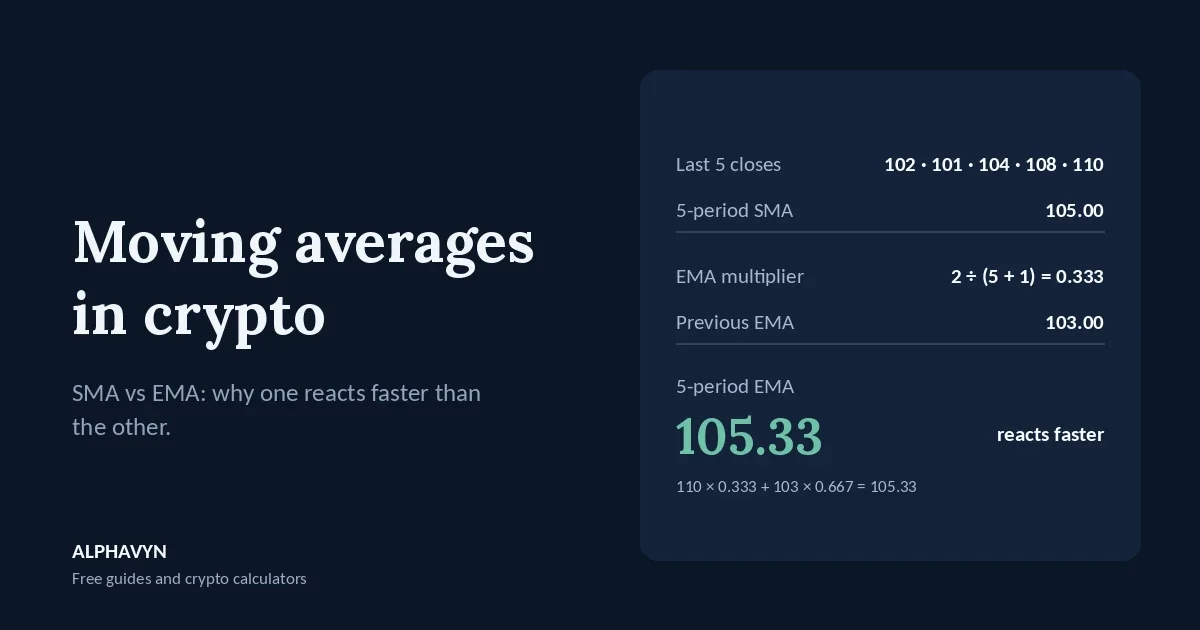
For a 5-period EMA, the multiplier is 2 ÷ (5 + 1) = 0.333.
Example: using the same numbers, start with the previous average of 103 and add the new close of 110:
EMA = 110 × 0.333 + 103 × 0.667 = 36.67 + 68.67 = 105.33
The new close moved the EMA to 105.33, while the SMA only reached 105. With a period of 5 the difference is small, but the principle holds at every length: the EMA reacts to new prices sooner. Your chart does all of this automatically. The formula just shows why the lines behave differently.
What is a weighted moving average (WMA)?
The weighted moving average also gives more weight to recent closes, but in a simple, fixed way: the newest close gets the highest weight, the one before it a little less, and so on down to the oldest.
For a 5-period WMA, the weights are 1, 2, 3, 4 and 5, which add up to 15. The newest close is multiplied by 5 and the oldest by 1.
Example: using the same five closes, from oldest to newest: 102, 101, 104, 108 and 110.
WMA = (102 × 1 + 101 × 2 + 104 × 3 + 108 × 4 + 110 × 5) ÷ 15
WMA = (102 + 202 + 312 + 432 + 550) ÷ 15 = 1,598 ÷ 15 = 106.53
Compare the three results for the same closes: SMA 105.00, EMA 105.33 and WMA 106.53. The WMA leans hardest toward the latest prices, so it sits closest to the newest close of 110.
What is a Hull moving average (HMA)?
The Hull moving average, developed by Alan Hull, is designed to be both fast and smooth, two things that usually work against each other. It’s built from several weighted moving averages: it combines a short WMA and a long WMA to cut most of the lag, then smooths the result with another WMA.
You don’t need to calculate it by hand. What matters is how it behaves:
It turns very quickly. The HMA often changes direction several candles before an SMA or EMA of the same length.
It stays fairly smooth. It has far fewer small wiggles than a short SMA would.
It can overshoot. At sharp turns, it can swing past the price briefly, which can give a false sense of a new trend.
Because of its speed, many traders use the HMA’s direction (rising or falling) rather than crossovers with the price.
How do SMA, EMA, WMA and HMA compare?
SMA | EMA | WMA | HMA | |
|---|---|---|---|---|
Weighting | Every close equal | More on recent closes, fading gradually | More on recent closes, in fixed steps | Built from WMAs to cut lag |
Speed | Slowest | Fast | Faster | Fastest |
Noise | Smoothest | Moderate | More sensitive | Smooth, but can overshoot |
Common use | Long-term trend and levels | Short-term direction and timing | Short-term direction | Quick changes in direction |
No type is best. A faster average shows a turn sooner, but it also gives more false turns. StockCharts’ ChartSchool explains in its guide to simple and exponential moving averages that the trade-off is always between lag and sensitivity.
The SMA and EMA are by far the most widely used, so they’re the ones most traders watch, and the 50 and 200 crosses in crypto news usually refer to them. A common approach is to use EMAs on shorter timeframes and SMAs on the daily chart, and to treat the WMA and HMA as faster alternatives once you know how the basic two behave. Whatever you choose, use it consistently.
Which moving average lengths do traders use?
Three lengths appear on more crypto charts than any others:
Length | Typical use |
|---|---|
20 | Short-term direction; pullbacks in strong trends often touch it |
50 | Medium-term trend; widely watched on the 4-hour and daily charts |
200 | Long-term trend; the daily 200 is one of the most watched lines in markets |
These numbers aren’t magic. They matter largely because so many traders watch them, which makes reactions around them more likely, in the same way that support and resistance levels work.
Shorter lengths follow the price closely and react to every swing. Longer lengths move slowly and only change direction after a sustained move.
How do I read the trend with moving averages?
Three simple checks give a quick picture:
1. Where is the price compared with the average? Price above the average means recent closes are higher than the average of the period; price below means they’re lower.
2. Which way is the average sloping? A rising average shows the trend is up; a falling one shows it’s down; a flat one shows the market is going sideways.
3. How are the averages stacked? When the 20 is above the 50 and the 50 is above the 200, all three agree on an uptrend. When the order is reversed, they agree on a downtrend. When the lines are tangled, there’s no clear trend.
The slope matters more than a single touch. A price that dips briefly below a rising 50-period average is very different from a price that closes below a 50-period average that has already turned down.
Can a moving average act as support or resistance?
Yes, often. In a strong uptrend, pullbacks frequently stop near a rising moving average, and in a downtrend, bounces often stall near a falling one. Because the line moves with the price, this is sometimes called dynamic support or resistance.
Example: a coin is in an uptrend on the 4-hour chart, and its last two pullbacks stopped right at the 50-period EMA. It pulls back again and touches the EMA near 2,210, which is also close to a horizontal support zone from earlier in the month. A 4-hour candle dips under the line but closes back above it.
When a moving average lines up with a horizontal level, the area tends to matter more. Like any level, it should be treated as a zone, not an exact price. Our beginner’s guide to support and resistance explains why, and our guide on how to read crypto candlestick charts explains why the close matters more than the wick.
Bollinger Bands are built around a 20-period moving average, as our guide to Bollinger Bands in crypto explains.
What are golden crosses and death crosses?
A crossover happens when a shorter moving average crosses a longer one. The two most famous use the 50 and 200 on the daily chart:
Golden cross: the 50-day average crosses above the 200-day average.
Death cross: the 50-day average crosses below the 200-day average.
They get a lot of attention in crypto news, but they come late. By the time a 50-day average catches up with a 200-day average, the price has usually already moved a long way. A golden cross often appears after a strong rally, and a death cross after a large fall.
Crossovers are better at confirming a change that has already happened than at predicting the next move. Treat them as background information about the long-term trend, not as a buy or sell button.
Why do moving averages fail in sideways markets?
Moving averages are built for trends. When the price moves sideways in a range, the average flattens out and the price keeps crossing it in both directions.
Example: a coin moves between 95 and 105 for six weeks. The 20-period average sits near 100, and the price crosses it up and down a dozen times. A trader buying every cross above the line and selling every cross below it would collect a long series of small losses, plus fees on every trade.
Faster types like the WMA and HMA don’t solve this. They react sooner, which in a range often means even more false crosses. The warning sign is a flat average with the price weaving around it. In that situation, horizontal support and resistance usually tell you more than any moving average does.
How do moving averages fit with other indicators?
A moving average shows the direction of the trend. It doesn’t show how strong the move is, or how much trading stands behind it.
Momentum: RSI shows whether the move behind the trend is strengthening or fading. Our guide on how to use RSI in crypto explains how.
Volume: a move above a key average on high volume carries more weight than one on very quiet trading.
Levels: horizontal support and resistance show where the trend may pause.
MACD, which our trend, momentum, volume and structure guide introduces, is itself built from two exponential moving averages.
For a trend indicator built from midpoints instead of averages, see our guide to the Ichimoku Cloud in crypto.
How does ALPHAVYN use moving averages?
You can add moving averages to any USDT pair on the free live crypto charts and choose between four types: SMA, EMA, WMA and HMA. Try the same length in different types on one chart to see how much faster the WMA and HMA react than the SMA, and compare them across timeframes together with RSI, volume and other indicators.
The pair analyzer uses moving averages in its trend reading, checking where the price sits against its short-, medium- and long-term averages on the 1-hour and 4-hour charts. It’s a quick check to support your own research, not a signal.
What are common moving average mistakes?
Trading every crossover. In sideways markets, crossovers produce a series of small losses.
Expecting exact bounces. Price often overshoots a moving average slightly before reacting. Treat it as a zone.
Using too many lines. Five or six averages on one chart mostly create confusion. Two or three are enough.
Ignoring the slope. A price above a flat or falling average is a much weaker sign than a price above a rising one.
Switching types and lengths to fit the chart. Pick a type and a few standard lengths and keep them, so you learn how they behave.
Frequently asked questions
Which moving average is best for crypto?
There’s no single best one. The 20, 50 and 200 SMA and EMA are the most widely watched, which is part of why they work. EMAs suit shorter timeframes where speed matters, SMAs suit longer-term views where smoothness matters, and the WMA and HMA are faster options for traders who want to see changes in direction sooner.
For an average weighted by volume instead of time, see our guide on what is VWAP in crypto.
Is the HMA better than the EMA?
Not better, just faster. The HMA reacts to changes in direction sooner than an EMA of the same length, which helps on quick moves but also produces more false turns and can overshoot at sharp reversals. Many traders start with the EMA, then try the HMA once they know what normal lag looks like.
Is the 200-day moving average important in crypto?
It’s one of the most watched lines in any market, so many traders treat the price being above or below it as a quick summary of the long-term trend. It reacts very slowly, though, so it’s a background reading, not a timing tool.
Does a golden cross mean the price will go up?
No. A golden cross shows that the medium-term average has risen above the long-term average, which usually happens after a rise has already taken place. Prices can fall after a golden cross and rise after a death cross. Crypto assets are volatile, and the U.S. SEC notes that the risk of loss remains significant.
Should I place my stop loss at a moving average?
Some traders do, but a stop right on the line is easy to hit with a quick wick. If a moving average lines up with your trade idea, place the stop beyond it with a buffer, and size the position from that distance. Our guide on where to place a stop loss in crypto covers buffers, and the position size calculator does the sizing.
Open the free live crypto charts, add the 20, 50, and 200 to the daily chart of a pair you follow, and note how they’re stacked and which way they slope. Then try the same length as an SMA and an HMA, and check the pair in the pair analyzer to see its trend reading.