Open any crypto chart, and you’ll see rows of small green and red bars. Each one is a candlestick, and each one tells a short story about what buyers and sellers did during a set period of time. Once you can read a single candle, the whole chart becomes easier to understand: where the price was rejected, where one side took control, and when a level held or broke. This guide explains how to read candles step by step, with simple numbers. You can follow along on our free live crypto charts.
What is a candlestick?
A candlestick shows four prices for one period of time:
Price | What it means |
|---|---|
Open | The price when the period started |
High | The highest price reached during the period |
Low | The lowest price reached during the period |
Close | The price when the period ended |
These four prices are often shortened to OHLC.
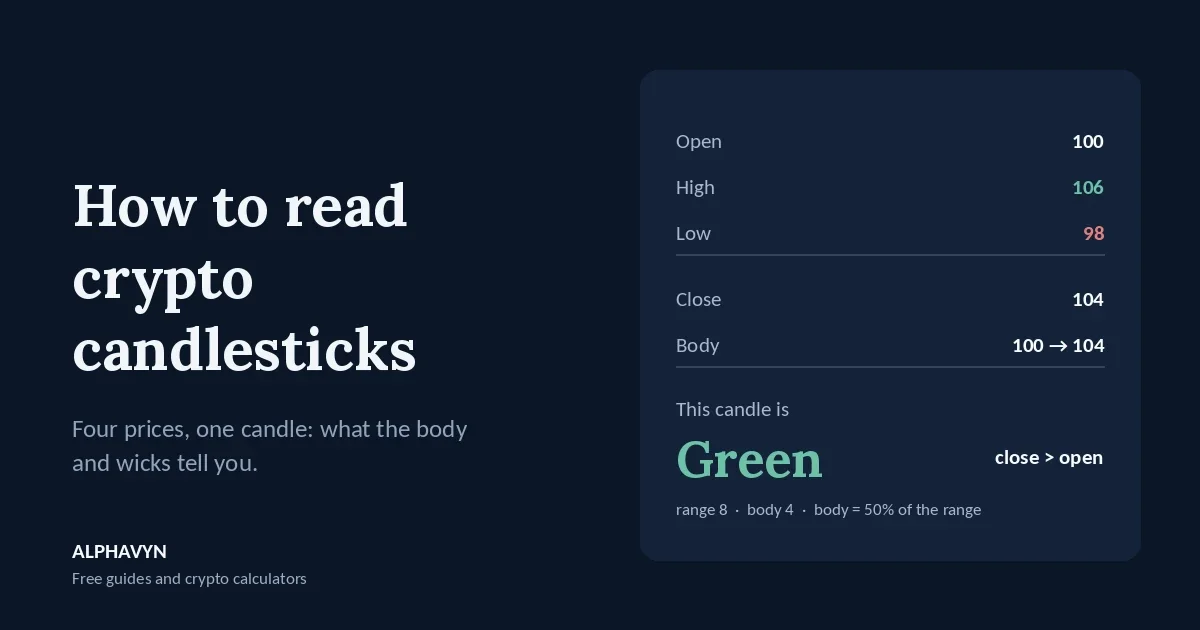
Example: during one hour, a coin opens at 100, rises as high as 106, dips as low as 98, and closes at 104. On a chart, that hour becomes one candle:
The body is the thick part, from the open (100) to the close (104).
The upper wick is the thin line from the top of the body (104) to the high (106).
The lower wick is the thin line from the bottom of the body (100) to the low (98).
Wicks are also called shadows. StockCharts’ introduction to candlesticks covers the same parts if you want a second explanation.
What do green and red candles mean?
The color only compares a candle’s close with its own open:
Green: the close is above the open. The price rose during that period.
Red: the close is below the open. The price fell during that period.
In the example above, the close (104) is above the open (100), so the candle is green.
Red example: a coin opens at 104, rises to 105, falls to 97, and closes at 99. The close is below the open, so the candle is red. Its body runs from 104 down to 99.
Some platforms use other colors, such as white and black, or let you change them. The meaning is the same: one color for closes above the open, another for closes below.
What do the body and wicks tell you?
The shape of a candle shows who was stronger during that period, and where the other side pushed back.
A large body with small wicks means one side was in control most of the time. A big green body shows strong buying; a big red body shows strong selling.
A long lower wick means sellers pushed the price down during the period, but buyers pushed it back up before the close. The market rejected the lower prices.
A long upper wick means buyers pushed the price up, but sellers pushed it back down. The market rejected the higher prices.
A small body with long wicks on both sides means both sides pushed hard, but neither won. It shows indecision.
You can measure this simply. In the first example, the full range is 106 − 98 = 8, and the body is 104 − 100 = 4. The body is half of the range, a fairly decisive candle. If the body were only 0.5 inside the same range, the candle would show far more hesitation.
What does the timeframe mean?
The timeframe is how much time each candle covers. On a 1-hour (1H) chart, each candle is one hour. On a 4-hour (4H) chart, each candle is four hours. On a daily (1D) chart, each candle is one day.
Longer candles are built from shorter ones. Twenty-four 1-hour candles make one daily candle: its open is the open of the first hour, its close is the close of the last hour, its high is the highest high of the day, and its low is the lowest low.
This is why the same moment can look very different on different timeframes. A sharp red 1-hour candle may be just a small wick on the daily chart. Shorter timeframes show more detail but also more noise; longer ones show the bigger picture. Our beginner’s guide to support and resistance explains why many traders start with the daily chart, and our guide to trend, momentum, volume and structure shows how the 1H and 4H readings can be combined.
Crypto trades around the clock, so there is no opening or closing bell, and each platform chooses its own time zone for candles. Many exchanges use UTC. On our free live crypto charts, times are shown in UTC by default, and one button switches them to your local time, so you can match each candle to your own clock. When you compare charts across platforms, check that both use the same time zone, because a different start time can change how daily candles look.
Why does the close matter more than the wick?
A candle isn’t finished until its period ends. Until then, the price can move up and down, and the candle can change shape completely. A candle that looks like a strong breakdown halfway through the hour can close as a candle with a long lower wick and a green body.
This matters most around support and resistance.
Example: support is around 2,200. A 4-hour candle drops to 2,170 during the period, but buyers push it back, and it closes at 2,215.
The wick went below support.
The close stayed above it.
Many traders read this as support holding, not breaking: sellers tried and failed. If the same candle had closed at 2,160, well below the zone, that would be a much stronger sign of a real break.
Wicks through obvious levels are common in crypto. That’s one reason our guide on where to place a stop loss in crypto recommends a small buffer beyond a level rather than a stop right on it. For leveraged positions, a wick can be even more costly: a brief spike can reach the liquidation price and close the position, even if the candle closes far away. Our guide to the crypto liquidation price explains that risk. ALPHAVYN does not recommend using leverage.
What are five basic candlestick patterns?
There are dozens of named patterns, but beginners only need a few. Here are five common ones, with simple numbers.
Pattern | Example (open / high / low / close) | What it shows |
|---|---|---|
Doji | 100 / 103 / 97 / 100.05 | Open and close almost equal: indecision |
Hammer | 100 / 101 / 94 / 100.8 | Long lower wick: lower prices rejected |
Shooting star | 100 / 106 / 99.2 / 99.4 | Long upper wick: higher prices rejected |
Bullish engulfing | Red 102 → 99, then green 99 → 102.5 | Buyers took back the whole previous candle |
Bearish engulfing | Green 100 → 103, then red 103 → 99.5 | Sellers took back the whole previous candle |
Doji. The body is tiny because the open and close are almost the same, while the wicks show the price moved both ways. On its own, a doji says only that neither side won that period.
Hammer. A small body near the top of the candle and a lower wick at least twice as long as the body. In the example, the lower wick is 100 − 94 = 6, while the body is just 0.8. After a fall, it shows that sellers pushed the price down but buyers took most of it back.
Shooting star. The mirror image of a hammer: a small body near the bottom and a long upper wick. In the example, the upper wick is 106 − 100 = 6. After a rise, it shows that buyers pushed up but sellers took it back.
Bullish engulfing. A red candle followed by a green candle whose body covers the whole red body. In stock markets, the second candle often opens with a gap. Crypto trades nonstop, so a new candle usually opens right at the previous close, and the pattern is judged by whether the second body covers the first.
Bearish engulfing. The opposite: a green candle followed by a red candle whose body covers the whole green body.
Why do candlestick patterns fail on their own?
A pattern describes what happened in one or two candles. It does not predict what happens next. A hammer in the middle of nowhere says much less than a hammer right at a well-tested support level.
Three things make a pattern more meaningful:
Location. Patterns at clear support or resistance matter more than patterns in the middle of a range.
Volume. A rejection candle on high volume shows more participation than one on very quiet trading. Our trend, momentum, volume and structure guide explains how to compare volume with its recent average.
Confirmation. Many traders wait for the next candle to move in the expected direction before acting, accepting a slightly worse price in exchange for more evidence.
Even with all three, patterns fail often. That’s why every trade still needs a stop loss and a position size based on your risk.
How do candles fit into a trade plan?
Candles help you choose where and when to act, but the plan still follows the same steps.
Example: support is near 100, and a 4-hour hammer forms there with a low of 94 and a close of 100.8. A trader who wants to buy might:
Wait for the candle to close, so the hammer is confirmed.
Place the stop loss a little below the hammer’s low, for example at 93.50, because a move below the low would show the rejection failed.
Choose targets at the next resistance levels.
Size the position so a stop-loss hit costs only the amount chosen in advance, using the position size calculator.
Our guide on how to plan a crypto trade walks through each step in full.
What are common mistakes when reading candles?
Acting before the candle closes. A candle can change completely before its period ends.
Reading very short timeframes. One-minute and five-minute candles are full of noise. Start with 4H and daily.
Memorizing dozens of patterns. A few patterns, read in the right location, are more useful than a long list.
Ignoring the bigger picture. A bullish pattern on the 1H chart means little if the price is pressed under major daily resistance.
Trusting candles on very small coins. Low-volume coins can print long wicks from a few large orders, so their candles are less reliable.
Frequently asked questions
Which timeframe is best for beginners?
Many beginners start with the 4-hour and daily charts. They update slowly enough to think clearly, and their levels are watched by more traders. Shorter timeframes can then help fine-tune an entry.
Do candlestick patterns work in crypto?
They describe real buying and selling, so they can be useful, especially at key levels. But no pattern works every time, and crypto can move sharply against any setup. Crypto assets are volatile, and the U.S. SEC notes that the risk of loss remains significant.
What is the difference between a wick and the body?
The body shows where the price opened and closed. The wicks show how far it traveled beyond that during the period. The body tells you who won the period; the wicks tell you where the other side pushed back.
Is a green candle always bullish?
No. A green candle only means the close was above the open for that period. A small green candle after a long fall, right under resistance, can still be part of a downtrend. Read candles together with the trend and the levels around them.
Practice by opening the free live crypto charts, switching between the 1H, 4H, and daily timeframes, and marking where long wicks appear near support and resistance. Then check the same pair in the pair analyzer to see its nearest levels.