Parabolic SAR is easy to spot on a chart: a trail of dots that follows the candles, sitting below them when price rises and above them when it falls. Each candle, the dots creep closer to price, and the longer a trend runs, the faster they close in. When price finally meets them, they jump to the other side.
That behavior makes Parabolic SAR one of the simplest ways to follow a trend and to trail a stop. In this guide, we’ll go through how the dots are calculated, what the acceleration factor does, when they flip, and where they fail, using a real BTC/USDT chart. You can add Parabolic SAR to any USDT pair on our free live crypto charts and follow along.
What is Parabolic SAR?
J. Welles Wilder developed Parabolic SAR and published it in 1978. He’s the same person who created RSI, ATR and ADX. SAR stands for Stop And Reverse: the dots mark a level where a trade in the current direction would be stopped out, and where the indicator reverses to the other direction.
Dots below the candles: the indicator reads the trend as up.
Dots above the candles: the indicator reads the trend as down.
Why “parabolic”? Because in a steady trend, the dots trace a curve that bends toward price faster and faster, like a parabola.
How is Parabolic SAR calculated?
Each new dot is calculated from the previous one:
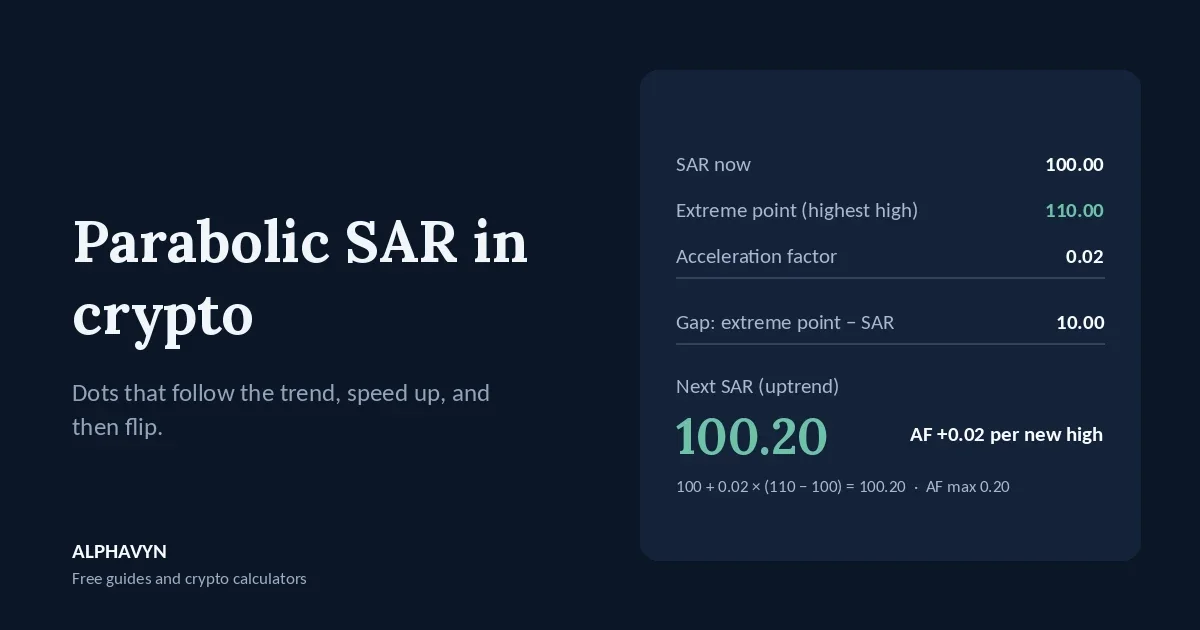
Next SAR = SAR + AF × (EP − SAR)
SAR is the current dot.
EP, the extreme point, is the highest high of the current uptrend, or the lowest low of the current downtrend.
AF, the acceleration factor, controls how fast the dots move toward price.
Example: in an uptrend, the SAR is 100, the highest high so far is 110, and the acceleration factor is 0.02.
Next SAR = 100 + 0.02 × (110 − 100) = 100 + 0.20 = 100.20
So the dot moved up by 0.20, a small step toward price. Don’t worry about doing this by hand, because your chart does it automatically for every candle.
What does the acceleration factor do?
The acceleration factor is what makes Parabolic SAR speed up. It follows three settings:
Start: the acceleration factor at the beginning of each new trend, usually 0.02.
Step: how much it increases each time the trend makes a new extreme, usually 0.02.
Maximum: the highest it can go, usually 0.20.
Example: continuing the uptrend above, price makes a new high at 112. The extreme point is now 112, and the acceleration factor rises from 0.02 to 0.04.
Next SAR = 100.20 + 0.04 × (112 − 100.20) = 100.20 + 0.472 = 100.672
This time, the dot moved up by about 0.47, more than twice as far as before. Every new high makes the dots move faster, until the acceleration factor reaches its maximum of 0.20. That’s why, in a long trend, the dots close in on price quickly.
When does Parabolic SAR flip?
In Wilder’s original rules, the dots flip when price reaches them:
In an uptrend, when price falls to the dot below it, the indicator flips to a downtrend. The new dots start above price, at the highest point of the trend that just ended.
In a downtrend, when price rises to the dot above it, the indicator flips to an uptrend, and the new dots start below price, at the lowest point of the trend that just ended.
After each flip, the acceleration factor starts again from 0.02, so the new dots begin slowly.
How do I read Parabolic SAR on the ALPHAVYN chart?
Let’s look at a real one. Here is Parabolic SAR on the BTC/USDT 4-hour chart at 10:29 UTC on 24 October 2026, with price at 80,604.00. The label reads:
SAR(2,2,20) SAR: 81,706.64
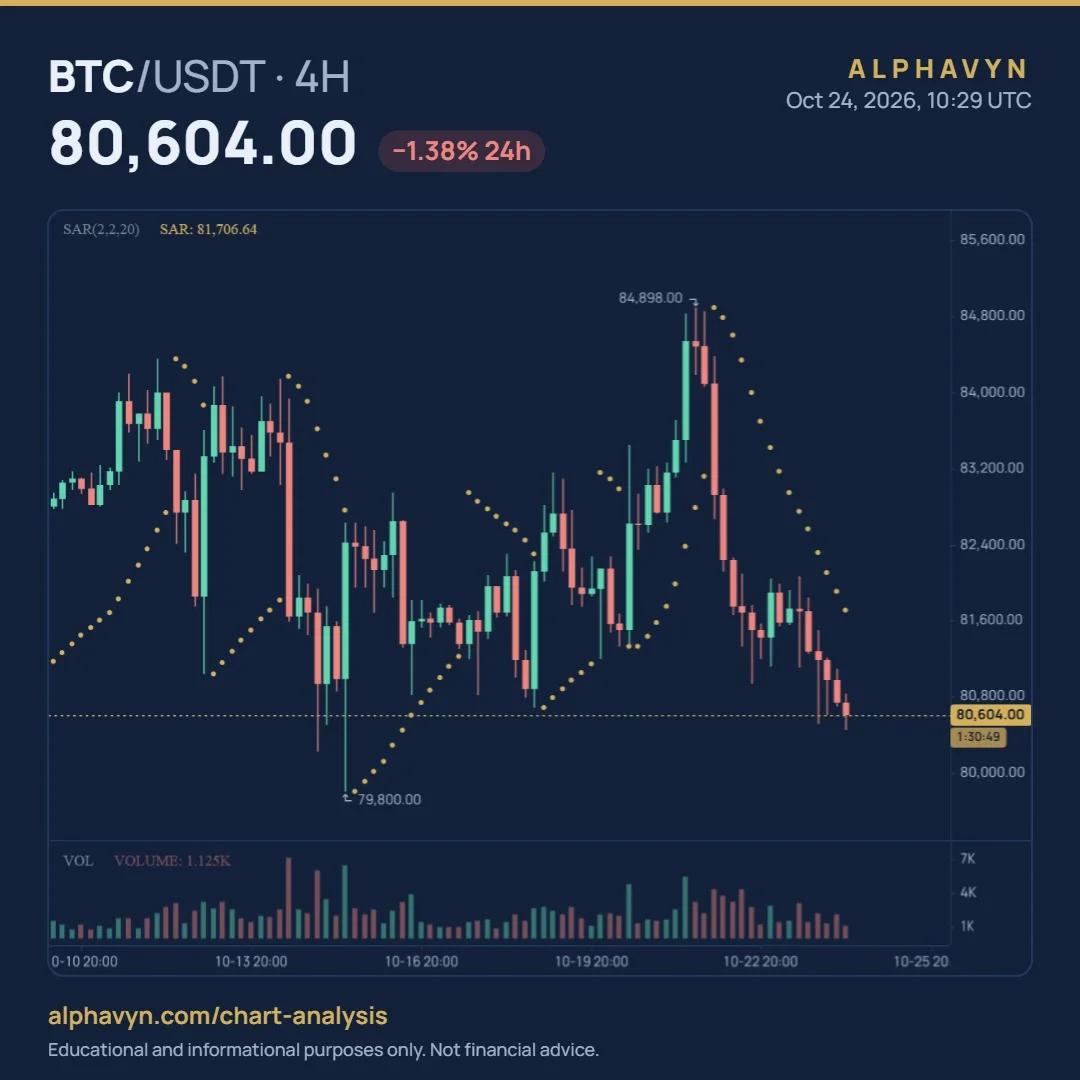
A quick note on the settings: our chart writes them as whole numbers, ×100. A start of 2 means 0.02, a step of 2 means 0.02, and a maximum of 20 means 0.20. So SAR(2,2,20) is the standard setting.
Here’s what the chart is telling us:
The dots are above price. At 81,706.64, the SAR sits 1,102.64 above the price of 80,604.00, so the indicator reads the trend as down.
The dots have been above price since 21 October. After BTC reached 84,898, price turned down and met the rising dots below it. The indicator flipped, and the new dots started near the 84,898 high, the highest point of the uptrend that had just ended.
The dots are speeding up. Since then, each new low has moved the dots down faster, and they’re now much closer to price than when the downtrend began.
The chart also shows Parabolic SAR’s main weakness. Between about 10 and 20 October, while BTC moved sideways between roughly 80,000 and 84,000, the dots flipped from below to above price and back again many times. In a market without a clear trend, the dots keep getting reached, and each flip reverses soon after.
You can change the start, step and maximum in the indicator settings.
How do traders use Parabolic SAR?
As a trailing stop. This is what Wilder designed it for. In a long trade, you move the stop up to the latest dot below price each candle. In a short trade, you move it down to the latest dot above price. Because the dots speed up as the trend extends, the stop tightens as the move matures. Our guide on where to place a stop loss in crypto explains trailing stops in its FAQ.
As a trend filter. Some traders only look for long trades while the dots are below price, and for short trades (or no trades) while they’re above.
With a trend-strength check. Because Parabolic SAR whipsaws in sideways markets, many traders only follow it when another tool confirms a trend. Our guide to the ADX indicator in crypto explains how ADX above 25 is often read as a trending market.
And whatever the dots show, size every trade so a stop-loss hit costs only what you chose to risk. The position size calculator does that math for you.
Should I change the Parabolic SAR settings?
The standard 0.02, 0.02 and 0.20 are the most widely used and a good place to start. Here’s what changing them does:
Change | Effect |
|---|---|
Smaller start or step (for example 0.01) | Dots move more slowly; fewer flips, but they react later |
Larger start or step (for example 0.03) | Dots move faster and sit closer to price; more flips |
Lower maximum (for example 0.10) | Dots can’t speed up as much in long trends |
Higher maximum (for example 0.30) | Dots can close in very quickly in long trends |
The trade-off is simple: faster settings catch turns earlier but whipsaw more, while slower settings whipsaw less but give back more of the move before flipping. Keep one setting long enough to learn how it behaves on the coins and timeframes you trade.
How is Parabolic SAR different from Supertrend?
Both draw a trailing line that flips sides with the trend, but they’re built differently:
Parabolic SAR | Supertrend | |
|---|---|---|
Built from | The trend’s extreme point and an accelerating factor | The candle midpoint and ATR |
Moves | Toward price every candle, faster as the trend extends | Only with the trend; can stay flat |
Flips (standard rules) | When price reaches the dots | When a candle closes beyond the line |
Drawn as | Dots | A line |
Parabolic SAR tightens on its own over time, which makes it a tighter trailing stop in long trends but also more prone to early flips. Our guide to the Supertrend indicator in crypto explains Supertrend in full.
What are the limits of Parabolic SAR?
Like every indicator, it has weak spots. Keep these in mind:
It whipsaws in sideways markets. When price moves back and forth, the dots keep flipping, as the BTC/USDT chart shows between 10 and 20 October.
It’s always in the market. The dots are always either above or below price, so the indicator always shows a trend, even when there isn’t one.
It can flip early in volatile markets. A single sharp wick can reach the dots and flip them.
It shows direction only. It says nothing about momentum, volume or key levels.
Frequently asked questions
What are the best Parabolic SAR settings for crypto?
The standard 0.02 start, 0.02 step and 0.20 maximum are the most widely used and a good starting point. On our chart, they appear as 2, 2 and 20, because the settings are shown ×100.
What does it mean when the Parabolic SAR dots are above the price?
The indicator reads the trend as down. The dots will keep moving down toward price until price reaches them, and then they’ll flip below price.
Is a Parabolic SAR flip a buy or sell signal?
Not on its own. A flip only shows that price reached the dots, so the trend reading has changed. Flips often reverse quickly in sideways markets, so many traders combine them with a trend-strength check and support and resistance. Our beginner’s guide to support and resistance explains how to find these levels.
Can I use Parabolic SAR as a stop loss?
Yes, that’s what it was designed for. In a trending market, moving your stop to each new dot trails the trade and tightens as the trend extends. In a sideways market, the stop gets hit often. Keep in mind that crypto assets are volatile, and the U.S. SEC notes that the risk of loss remains significant.
Try it yourself
Open the free live crypto charts, add Parabolic SAR to the 4-hour chart of a pair you follow, and compare how often the dots flipped in trending weeks and in sideways ones. You’ll see the whipsaw problem for yourself in about a minute.