Some indicators need a lot of reading. Supertrend needs almost none: one line, either green under price or red above it. Green means the trend is up, red means it’s down, and the moment it changes color is the moment the trend has flipped.
That simplicity is exactly why it’s so popular, and also why it’s easy to misuse. In this guide, we’ll go through how Supertrend is built from ATR, what makes it flip, how traders use it as a trailing stop, and where it fails, using a real BTC/USDT chart. You can add Supertrend to any USDT pair on our free live crypto charts and follow along.
What is the Supertrend indicator?
Supertrend is a trend-following line drawn on the price chart. It sits a set distance away from price, and that distance depends on how much price normally moves.
Green line below the price: Supertrend reads the trend as up.
Red line above the price: Supertrend reads the trend as down.
The line stays on one side until price closes beyond it. Then it flips to the other side and changes color.
The standard settings are written as Supertrend (10, 3): an ATR period of 10 and a multiplier of 3.
What is ATR, and why does Supertrend use it?
ATR, the Average True Range, measures how far price usually moves in one candle, averaged over a number of candles. A high ATR means big candles and a volatile market. A low ATR means small candles and a calm one.
Supertrend uses ATR so that its distance from price adapts to the market. In a volatile market, the line sits further away, so normal swings don’t flip it. In a calm market, it sits closer. Our guide on where to place a stop loss in crypto uses the same idea for volatility-based stops.
How is Supertrend calculated?
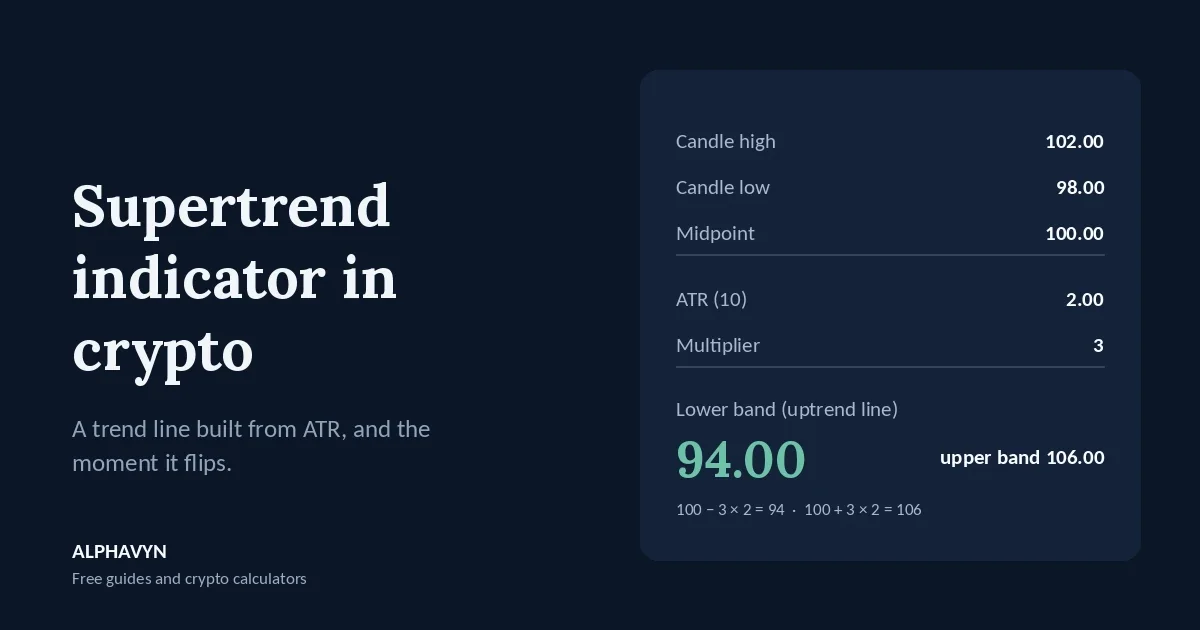
Supertrend starts from the midpoint of each candle and adds or subtracts a multiple of ATR:
Midpoint = (high + low) ÷ 2
Upper band = midpoint + multiplier × ATR
Lower band = midpoint − multiplier × ATR
Example: a candle has a high of 102 and a low of 98, the ATR over the last 10 candles is 2, and the multiplier is 3.
Midpoint = (102 + 98) ÷ 2 = 100
Upper band = 100 + 3 × 2 = 106
Lower band = 100 − 3 × 2 = 94
In an uptrend, Supertrend shows the lower band as a green line under price. In a downtrend, it shows the upper band as a red line above price. Your chart calculates all of this for every candle automatically.
Why does the Supertrend line only move in one direction?
This is the key to how Supertrend works. During an uptrend, the green line can move up or stay flat, but it never moves down. During a downtrend, the red line can move down or stay flat, but it never moves up.
So as price rises, the green line follows it upward like a ratchet. If price pulls back, the line stays where it is instead of falling with it. That’s why the line often looks like a staircase.
When does Supertrend flip?
Supertrend flips when a candle closes on the other side of the line:
In an uptrend, a close below the green line flips it to a red line above price.
In a downtrend, a close above the red line flips it to a green line below price.
A wick through the line isn’t enough. It’s the close that counts. Our guide on how to read crypto candlestick charts explains why the close matters more than the wick.
How do I read Supertrend on the ALPHAVYN chart?
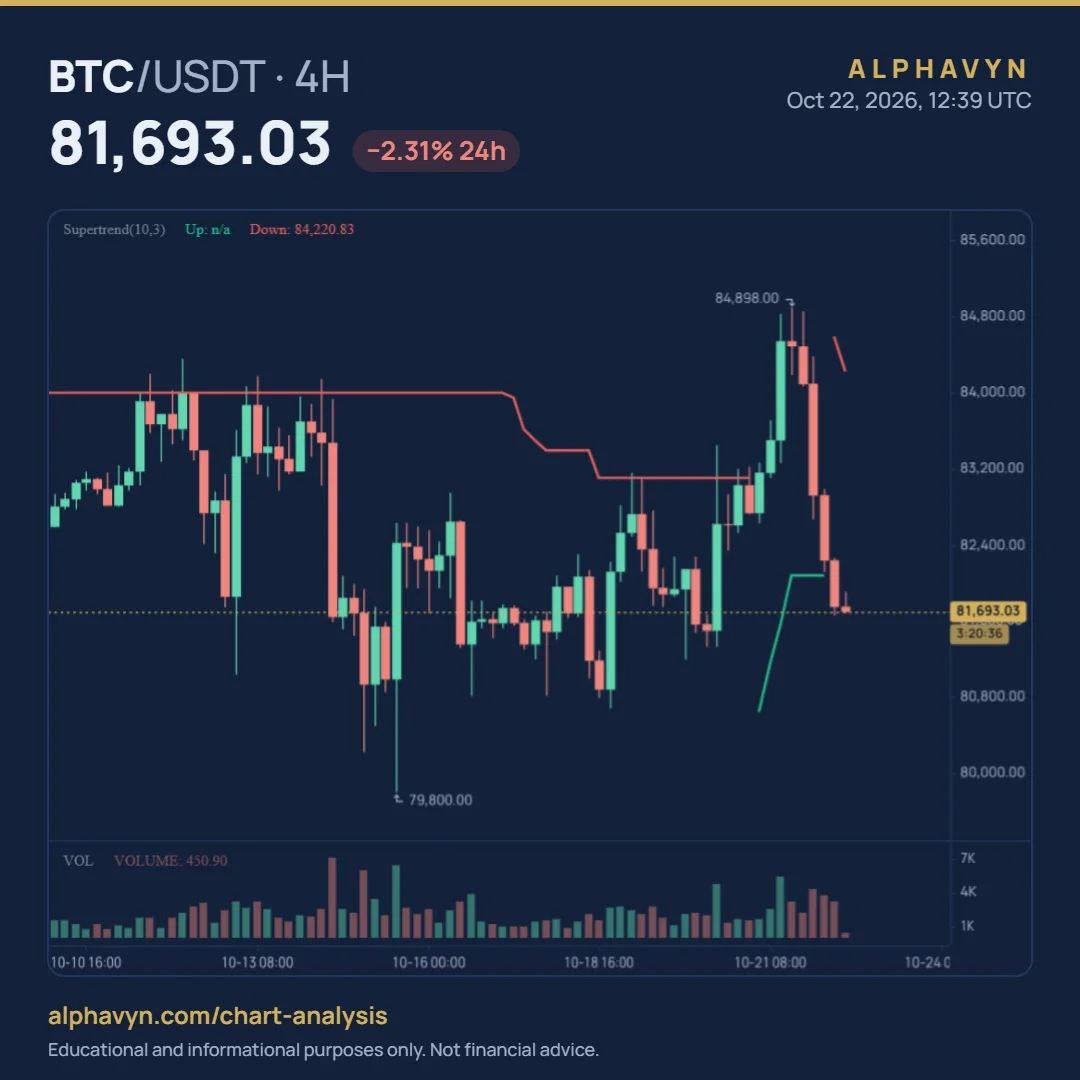
Let’s look at a real one. Here is Supertrend on the BTC/USDT 4-hour chart at 12:39 UTC on 22 October 2026, with price at 81,693.03. The label reads:
Supertrend(10,3) Up: n/a Down: 84,220.83
Up is the green line, shown during an uptrend.
Down is the red line, shown during a downtrend.
Supertrend shows only one line at a time. Right now the red line is active at 84,220.83, above price, so Supertrend reads the trend as down. The green line isn’t drawn, which is why the label shows Up: n/a.
The chart shows a full cycle:
A long downtrend. From the start of the chart until 20 October, the red line stayed above price. It stepped down a few times but never rose, just as the ratchet rule says.
A flip up. On 21 October, price rallied and a candle closed above the red line. Supertrend flipped: the red line disappeared, and a green line appeared below price and rose with the rally toward 84,898.
A flip back down. On 22 October, price fell sharply and a candle closed below the green line. Supertrend flipped back to red, now at 84,220.83.
Notice how short that uptrend reading was: only about a day. That’s a typical whipsaw, a flip that reverses soon after. It’s the main weakness of Supertrend, especially when price isn’t trending clearly.
You can change the ATR period and the multiplier from the default 10 and 3 in the indicator settings.
How do traders use Supertrend?
As a trend filter. Many traders only look for long trades while Supertrend is green, and for short trades (or no trades) while it’s red. It doesn’t tell you where to enter, but it keeps you on the side of the trend.
As a trailing stop. Because the line only moves in the direction of the trend, it can act as a stop that follows the trade. In a long trade, you move the stop up to the green line as it rises, and the trade closes if a candle closes below it. Our guide on where to place a stop loss in crypto explains trailing stops in its FAQ.
With levels. A flip to green right as price breaks above a resistance level carries more weight than a flip in the middle of a range. Our beginner’s guide to support and resistance explains how to find these levels.
And whatever Supertrend shows, size every trade so a stop-loss hit costs only what you chose to risk. The position size calculator does that math for you.
Should I change the Supertrend settings?
The default 10 and 3 are the most widely used and a good place to start. Here’s what changing them does:
Change | Effect |
|---|---|
Lower multiplier (for example 2) | Line sits closer to price; flips sooner and more often |
Higher multiplier (for example 4) | Line sits further away; fewer flips, but each comes later |
Shorter ATR period (for example 7) | Distance reacts faster to changes in volatility |
Longer ATR period (for example 14) | Distance changes more slowly and smoothly |
The trade-off is always the same: faster settings catch turns earlier but whipsaw more, while slower settings whipsaw less but give back more of the move before flipping. Keep one setting long enough to learn how it behaves on the coins and timeframes you trade.
What are the limits of Supertrend?
Supertrend is simple, but it isn’t magic. Keep these weak spots in mind:
It whipsaws in sideways markets. When price moves back and forth, Supertrend can flip several times in a short period, as in the BTC/USDT example.
It lags. A flip only comes after price has already moved far enough to close beyond the line.
It gives one reading only. It shows direction, not momentum, volume or where the next level is.
The distance can be large. With a multiplier of 3, the line can sit far from price in volatile markets, which makes it a wide stop.
To check whether the market is trending strongly enough for Supertrend, take a look at our guide to the ADX indicator in crypto.
How is Supertrend different from moving averages?
Both follow the trend, but in different ways. A moving average sits in the middle of the price action and gets crossed often. Supertrend sits a volatility-based distance away and only flips on a clear close beyond it, so it changes direction less often. Our guide to moving averages in crypto explains how averages read the trend, and our guide to the Ichimoku Cloud in crypto shows another way to read the trend at a glance.
Parabolic SAR is another trailing trend indicator, built from accelerating dots instead of ATR. See our guide to Parabolic SAR in crypto.
Frequently asked questions
What are the best Supertrend settings for crypto?
The standard 10 and 3 are the most widely used and a good starting point. A higher multiplier reduces whipsaws on very volatile coins, at the cost of later flips.
Why does the label show “Up: n/a”?
Supertrend shows only one line at a time: green during an uptrend, red during a downtrend. When the red line is active, there’s no green line, so its value shows as n/a. The reverse happens in an uptrend.
Is a Supertrend flip a buy or sell signal?
Not on its own. A flip shows that price has closed beyond the line, which means the trend reading has changed. Flips can reverse quickly, especially in sideways markets, so many traders combine them with support and resistance and other tools.
Can I use Supertrend as a stop loss?
Many traders use it as a trailing stop, because the line only moves in the direction of the trend. Keep in mind that with the default settings, the line can sit far from price, so size the position from that distance. Also remember that crypto assets are volatile, and the U.S. SEC notes that the risk of loss remains significant.
Try it yourself
Open the free live crypto charts, add Supertrend to the 4-hour chart of a pair you follow, and count how many times it flipped over the last few weeks. Then compare the flips with the support and resistance levels on the same chart. You’ll quickly see which flips had real follow-through and which were whipsaws.