Most trend tools answer one question: which way is the price going? Moving averages, Supertrend and the Ichimoku cloud all tell you whether the trend leans up or down. But they don’t tell you how strong that trend is, and that matters. A strong trend tends to keep going; a weak one often turns into sideways chop where trend tools give one false signal after another. ADX fills that gap. This guide explains what ADX and its two DI lines measure, how they’re calculated, how to read the 25 level, and where ADX misleads, using a real BTC/USDT chart. You can add ADX/DMI to any USDT pair on our free live crypto charts.
What is ADX/DMI?
ADX and DMI were developed by J. Welles Wilder, who also created RSI and ATR, and published in 1978. The indicator has three lines, drawn in their own panel below the chart:
Line | Full name | Color on our chart | What it shows |
|---|---|---|---|
+DI | Positive Directional Indicator | Green | The strength of upward moves |
−DI | Negative Directional Indicator | Red | The strength of downward moves |
ADX | Average Directional Index | Gold | The strength of the trend, whichever way it goes |
+DI and −DI together are called the Directional Movement Index, or DMI. ADX is built from them. The standard setting is written as ADX (14, 14): a 14-period length for the DI lines and 14-period smoothing for ADX.
How do +DI and −DI work?
Each candle is compared with the one before it:
Upward movement is how much higher the high is than the previous high.
Downward movement is how much lower the low is than the previous low.
Only the bigger of the two counts for that candle; the other counts as zero. Over 14 candles, these moves are averaged and divided by the average true range (ATR), then scaled to 0 to 100:
+DI shows how strong the upward moves have been, compared with the normal range of candles.
−DI shows the same for downward moves.
When +DI is above −DI, upward moves have been stronger, which leans bullish. When −DI is above +DI, downward moves have been stronger, which leans bearish.
How is ADX calculated?
ADX starts from the gap between the two DI lines. The bigger the gap, the more one side is in control:
DX = 100 × |+DI − −DI| ÷ (+DI + −DI)
ADX = a smoothed average of DX over 14 periods
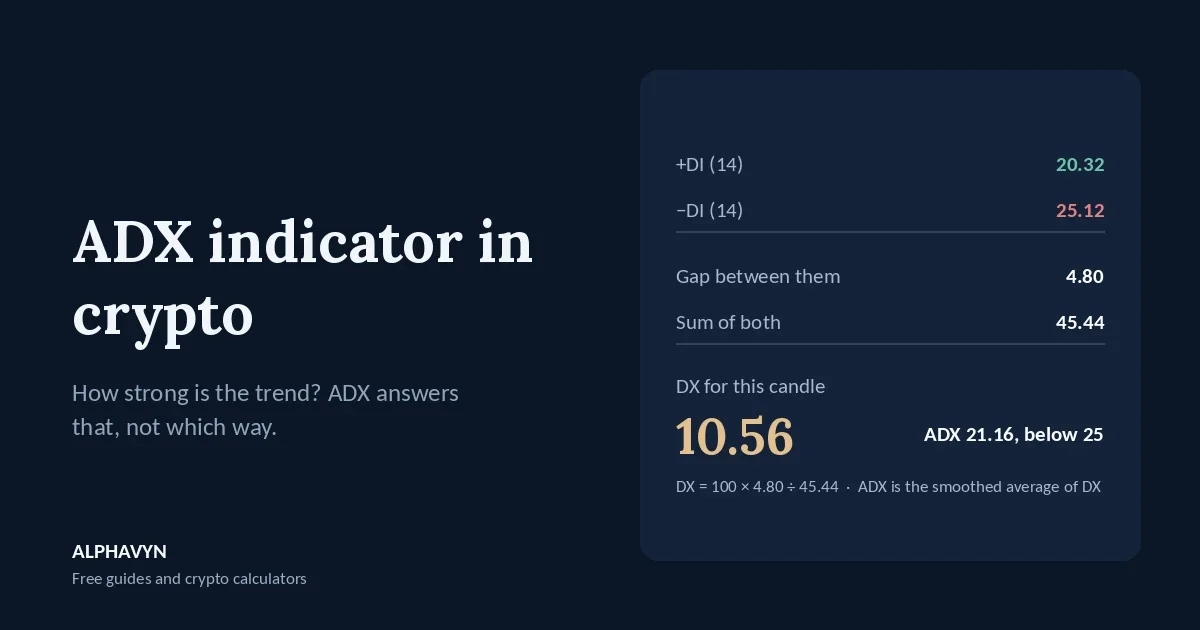
Example: using the readings from the BTC/USDT chart further down, +DI is 20.32 and −DI is 25.12.
Gap = |20.32 − 25.12| = 4.80
Sum = 20.32 + 25.12 = 45.44
DX = 100 × 4.80 ÷ 45.44 = 10.56
That’s the DX for the latest candle. ADX is the smoothed average of DX over many candles, so it moves more slowly. Your chart calculates all of this automatically.
Notice that the formula uses the size of the gap, not its direction. If +DI and −DI swapped places, DX would be the same. That’s why ADX measures strength only.
How do I read the ADX level?
ADX runs from 0 to 100, but in practice it rarely goes far above 60. Common guidelines:
ADX | A common reading |
|---|---|
Below 20 | Weak or no trend; the market is often moving sideways |
20 to 25 | A trend may be developing, but it isn’t strong yet |
Above 25 | A trending market |
Above 40 | A very strong trend |
On our chart, a dashed line marks 25, the most widely used dividing line between trending and non-trending markets. You can change the level or hide it in the settings.
The direction of ADX matters as much as its level:
Rising ADX: the trend, up or down, is getting stronger.
Falling ADX: the trend is losing strength, even if the price is still moving the same way.
Does a high ADX mean the price is going up?
No. This is the most common ADX mistake. ADX rises in strong downtrends just as it does in strong uptrends. A high ADX only says one side is clearly in control. To know which side, look at the DI lines: +DI on top means the strong trend is up; −DI on top means it’s down.
What does a DI crossover mean?
When +DI and −DI cross, the side with the stronger moves has changed:
+DI crossing above −DI: upward moves have become stronger. A bullish crossover.
−DI crossing above +DI: downward moves have become stronger. A bearish crossover.
Crossovers mean more when ADX is above 25 or rising, because there’s a trend behind them. When ADX is low, the DI lines often weave around each other, and crossovers are mostly noise.
How do I read ADX/DMI on the ALPHAVYN chart?
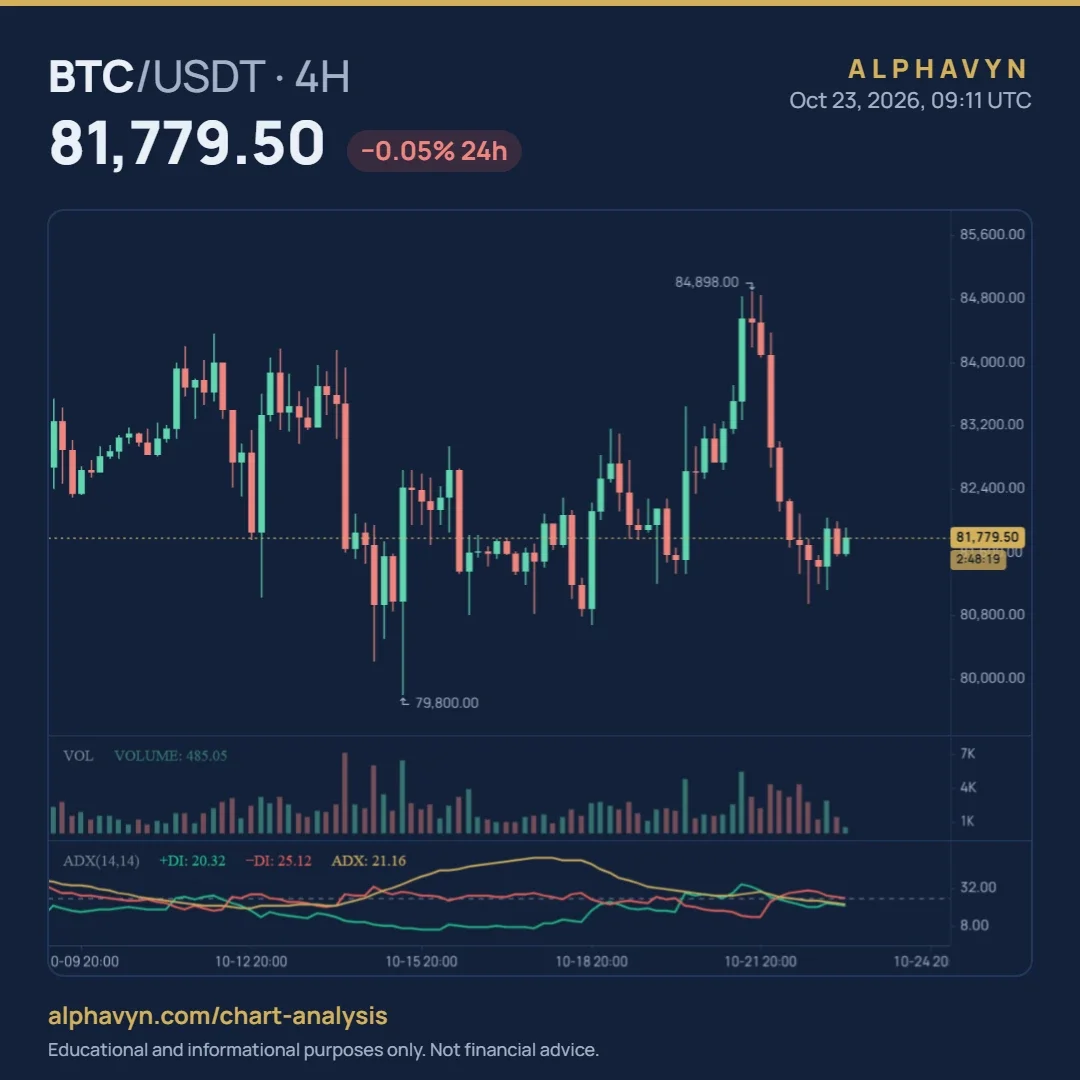
Here is ADX/DMI on the BTC/USDT 4-hour chart at 09:11 UTC on 23 October 2026, with the price at 81,779.50. The label reads:
ADX(14,14) +DI: 20.32 −DI: 25.12 ADX: 21.16
Reading it step by step:
−DI is above +DI. At 25.12 against 20.32, downward moves have been a little stronger than upward ones.
ADX is below 25. At 21.16, the market isn’t trending strongly in either direction.
The latest DX is below ADX. The DX for the latest candle, 10.56, is well under ADX at 21.16. Since ADX is an average of DX, readings this low tend to pull ADX down further, which fits a market losing direction.
The chart also shows how ADX behaved over the previous two weeks:
ADX rose during the drop and kept rising after it. As BTC fell toward 79,800 on 14 and 15 October, −DI rose far above +DI and ADX climbed well above 25. ADX reached its highest point a day or two after the low, while the price was already moving sideways. That’s ADX’s lag: it confirms a strong trend after much of the move has happened.
ADX fell as the market went sideways. From about 18 October, ADX drifted back down toward 25 as the price ranged.
The rally didn’t push ADX up. When the price rose to 84,898 on 21 October, +DI moved above −DI, but ADX stayed low. The move was sharp but short, and the indicator never read it as a strong trend. It reversed the next day.
You can change the DI length, the ADX smoothing and the level from the default 14, 14 and 25 in the indicator settings, and hide the level line if you prefer.
How do traders use ADX?
To choose the right tools. When ADX is above 25 and rising, trend tools like moving averages, Supertrend and the Ichimoku cloud tend to work better. When ADX is below 20, those tools often whipsaw, and range tools like support and resistance or the stochastic oscillator often fit better.
To filter trades. Many traders only follow trend signals when ADX is above 25, and skip them when it’s low.
To spot a fading trend. A falling ADX during a move can warn that the trend is losing strength, even before the price turns.
Whatever ADX shows, the trade still needs a stop loss where the idea would be wrong, and a position sized so the stop costs only what you chose to risk, using the position size calculator.
Should I change the ADX settings?
The default 14 and 14 are the standard and a good starting point. Here’s what changing them does:
A shorter DI length or smoothing (for example 7) makes the lines faster and more jumpy.
A longer one (for example 21) makes them smoother and slower.
A lower level (for example 20) counts more markets as trending.
A higher level (for example 30) counts only the clearest trends.
Changing the settings doesn’t make ADX more accurate. It moves the trade-off between speed and false readings. Keep the same settings long enough to learn how they behave, and use the 4-hour and daily charts for clearer readings.
What are the limits of ADX?
It lags. ADX is a smoothed average, so it often peaks after the strongest part of a move.
It doesn’t show direction on its own. Always check which DI line is on top.
Low ADX doesn’t mean low risk. A quiet market can still break out suddenly.
DI crossovers whipsaw when ADX is low. In sideways markets, the two DI lines cross often.
Frequently asked questions
What is a good ADX value for a trend?
Many traders treat ADX above 25 as a trending market and below 20 as weak or sideways. Above 40 is often read as a very strong trend. These are guidelines, not rules.
What is the difference between ADX and DMI?
DMI is the pair of lines, +DI and −DI, that show whether upward or downward moves have been stronger. ADX is built from the gap between them and shows how strong the trend is, without its direction.
Can ADX tell me when to buy?
Not on its own. ADX shows trend strength, not direction or timing. A bullish DI crossover with a rising ADX above 25 is a stronger trend reading, but it still needs support and resistance, a stop loss and a sized position. Crypto assets are volatile, and the U.S. SEC notes that the risk of loss remains significant.
Why did ADX rise when the price was falling?
Because ADX measures strength, not direction. A strong downtrend pushes ADX up just as a strong uptrend does. Check the DI lines: if −DI is on top, the strong trend is down.
Open the free live crypto charts, add ADX/DMI to the 4-hour chart of a pair you follow, and compare the last few weeks: where ADX was above 25, did trend tools work better than where it was low?