Most support and resistance levels are drawn by hand, which means two traders looking at the same chart can draw them in different places. Pivot points don’t have that problem. They come from a fixed formula using the previous day’s high, low and close, so everyone using the same method gets exactly the same levels.
That’s a big part of why they’re watched. When many traders see the same lines, price often reacts near them. In this guide, we’ll go through how classic pivot points are calculated, how to read them, and how to use them, with a real BTC/USDT chart where you can check every number. You can add pivot points to any USDT pair on our free live crypto charts and follow along.
What are pivot points?
Pivot points are a set of seven horizontal levels calculated from one period, usually the previous day:
Level | Name | What it is |
|---|---|---|
R3 | Resistance 3 | The furthest level above the pivot |
R2 | Resistance 2 | The second level above |
R1 | Resistance 1 | The first level above |
P | Pivot point | The central level, the average of the previous day |
S1 | Support 1 | The first level below |
S2 | Support 2 | The second level below |
S3 | Support 3 | The furthest level below |
They stay fixed for the whole day, then get recalculated when the next day starts.
How are pivot points calculated?
Classic pivot points use the previous day’s high (H), low (L) and close (C):
Level | Formula |
|---|---|
P | (H + L + C) ÷ 3 |
R1 | 2 × P − L |
S1 | 2 × P − H |
R2 | P + (H − L) |
S2 | P − (H − L) |
R3 | H + 2 × (P − L) |
S3 | L − 2 × (H − P) |
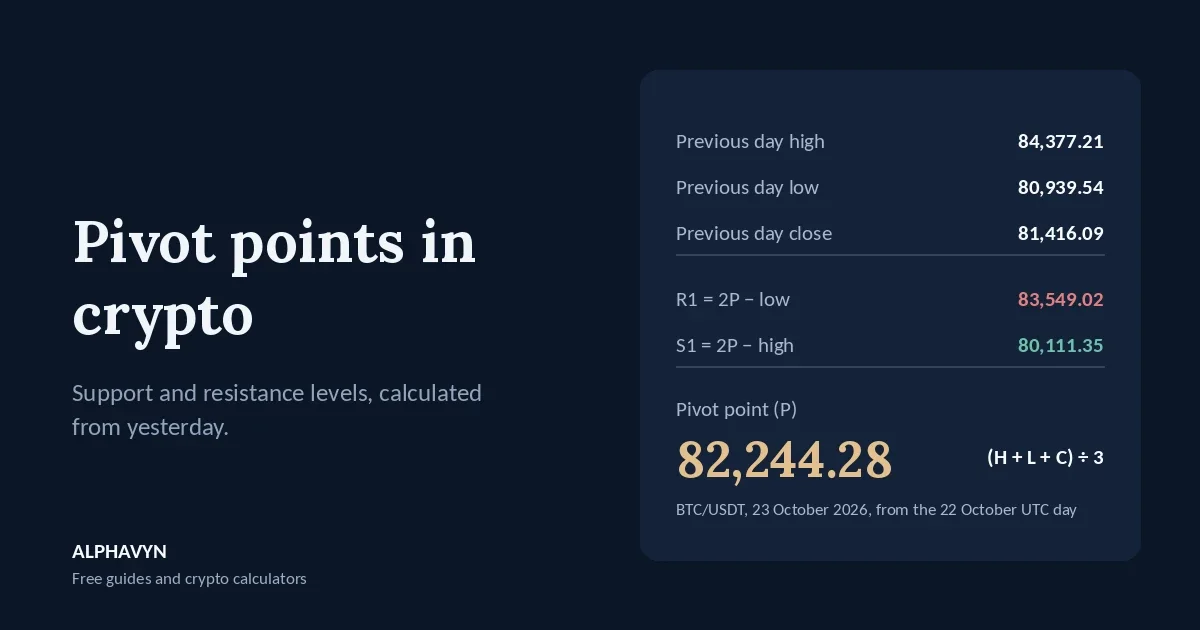
Let’s try it with real numbers. Example: BTC/USDT on 22 October 2026, using the UTC day. The high was 84,377.21, the low was 80,939.54 and the close was 81,416.09. The pivots for 23 October are:
P = (84,377.21 + 80,939.54 + 81,416.09) ÷ 3 = 82,244.28
R1 = 2 × 82,244.28 − 80,939.54 = 83,549.02
S1 = 2 × 82,244.28 − 84,377.21 = 80,111.35
R2 = 82,244.28 + (84,377.21 − 80,939.54) = 82,244.28 + 3,437.67 = 85,681.95
S2 = 82,244.28 − 3,437.67 = 78,806.61
R3 = 84,377.21 + 2 × (82,244.28 − 80,939.54) = 86,986.69
S3 = 80,939.54 − 2 × (84,377.21 − 82,244.28) = 76,673.68
These are exactly the levels on the chart further down, and your chart calculates them automatically each day.
One thing worth noticing: the previous day’s range, H − L, sets how far apart the levels are. After a volatile day, the levels spread wide. After a quiet day, they sit close together.
Why does the start of the day matter in crypto?
Stock markets have a clear daily open and close. Crypto trades nonstop, so “the previous day” depends on when the platform starts its day. A day that starts at 00:00 UTC gives a different high, low and close from one that starts at another hour, and so different pivot levels.
On our chart, daily pivot points use the UTC day, from 00:00 to 00:00 UTC, and the levels change at 00:00 UTC each day. If you compare pivots across platforms, check that they use the same day, or the numbers won’t match.
How do I read pivot points?
The pivot point sets the day’s bias. Many traders read price above P as a bullish lean for the day, and below P as a bearish lean. P itself is often where price reacts first.
R1 and S1 are the first targets and barriers. On many days, price moves between S1 and R1. A move beyond either one means a bigger-than-usual day.
R2, R3, S2 and S3 come into play on strong days. They’re reached less often. A day that reaches R3 or S3 is usually a day with a large move or major news.
Broken levels can switch roles. As with any support and resistance, a level that price breaks clearly can act the opposite way later in the day: a broken R1 can become support, and a broken S1 can become resistance. Our beginner’s guide to support and resistance explains role reversal.
How do I read pivot points on the ALPHAVYN chart?
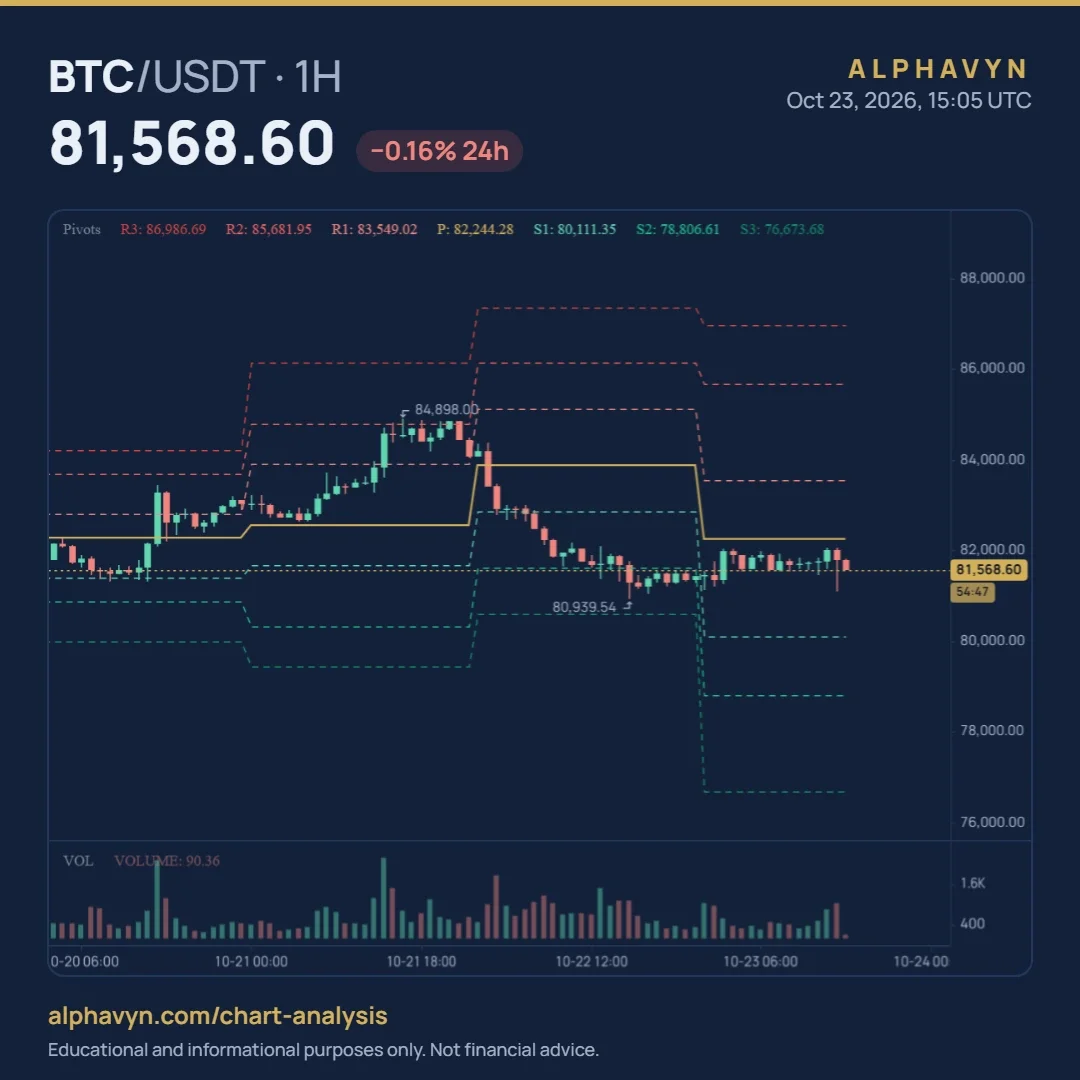
Let’s look at a real one. Here are pivot points on the BTC/USDT 1-hour chart at 15:05 UTC on 23 October 2026, with price at 81,568.60. The label reads:
Pivots R3: 86,986.69 R2: 85,681.95 R1: 83,549.02 P: 82,244.28 S1: 80,111.35 S2: 78,806.61 S3: 76,673.68
Here’s how to tell the lines apart:
The solid gold line is the pivot point, P.
The red dashed lines above it are R1, R2 and R3.
The green dashed lines below it are S1, S2 and S3.
The levels step to new values at the start of each UTC day.
Now let’s read 23 October. Price was 675.68 below P, sitting between P and S1. For most of the day, it traded just below the pivot, which is a mildly bearish lean but with little movement.
The chart also shows how the previous two days played out against their own levels:
21 October: price stayed above P all day, rose through R1, and stalled close to R2 near the 84,898 high before turning down.
22 October: the day’s pivot moved up after the strong 21 October. Price started the day near P, fell below it, and dropped through S1 and S2. The low of 80,939.54 came between S2 and S3.
How do traders use pivot points?
For intraday levels. Daily pivots are mainly used on shorter timeframes, such as the 15-minute and 1-hour charts, where a single day’s levels are clearly visible.
For the day’s bias. Some traders only look for long trades while price holds above P, and for short trades (or no trades) while it stays below.
For targets and stops. R1 and S1 are common first targets, and a stop just beyond a pivot level gives the trade a clear point where the idea is wrong. Our guide on where to place a stop loss in crypto explains why a small buffer beyond a level helps.
With other levels. A pivot level that lines up with a horizontal support zone, a moving average or the daily VWAP carries more weight than one on its own.
And whatever the levels show, don’t forget to size the position so the stop costs only what you chose to risk. The position size calculator does that math for you.
Are there other types of pivot points?
Yes. Besides the classic method, there are Fibonacci, Woodie and Camarilla pivots, which use different formulas and give different levels. Pivots can also be calculated from the previous week or month, for traders who hold positions longer. The classic daily version is the most widely used, and it’s the one this guide covers.
What are the limits of pivot points?
Pivot points are handy, but keep these weak spots in mind:
They’re based on one day. The levels only reflect the previous day’s range, not the bigger picture.
They don’t predict anything. They’re reference levels, and price can pass through all of them on a strong day.
Different day starts give different levels. Always check which day your platform uses.
They’re crowded. Because so many traders watch them, price often wicks through a level briefly before reacting. Look at where candles close. Our guide on how to read crypto candlestick charts explains why.
Frequently asked questions
How are pivot points calculated?
The classic pivot point is the average of the previous day’s high, low and close. The support and resistance levels are then calculated from that pivot and the previous day’s range. The full formulas are in the table above.
Which timeframe is best for pivot points?
Daily pivot points work best on intraday charts, such as 15-minute and 1-hour, where one day’s levels are easy to see.
When do pivot points change on ALPHAVYN?
Daily pivots are calculated from the previous UTC day and change at 00:00 UTC.
Do pivot points work in crypto?
They work as reference levels, especially on busy pairs like BTC/USDT, where many traders watch the same levels. They don’t guarantee a reaction. Keep in mind that crypto assets are volatile, and the U.S. SEC notes that the risk of loss remains significant.
Try it yourself
Open the free live crypto charts, add pivot points to the 1-hour chart of a pair you follow, and check yesterday’s candles: where did price react, and which levels did it break? It’s the fastest way to see how these lines behave in real life.