A moving average treats every candle the same, whether a hundred coins traded in it or a hundred thousand. VWAP doesn’t. It weights each price by how much was actually traded there, so the line sits where most of the buying and selling happened. That makes it one of the most practical lines on an intraday chart: a quick answer to “is the price above or below where most people traded today?” This guide explains how VWAP is calculated, how its daily, weekly, and monthly versions differ, what the bands show, and how traders use it. You can add VWAP to any USDT pair on our free live crypto charts.
What is VWAP?
VWAP stands for Volume Weighted Average Price. It’s the average price over a period, where each candle counts in proportion to its volume.
Two things set it apart from a normal moving average:
It’s weighted by volume. A candle with heavy trading pulls the line much more than a quiet one.
It restarts. A moving average always looks back the same number of candles. VWAP starts fresh at the beginning of each period, usually each day, and builds up from there.
VWAP is drawn on the price chart as one line. As the period goes on and more candles are added, the line tends to move more slowly, because each new candle is a smaller share of the total.
How is VWAP calculated?
VWAP uses the typical price of each candle, the average of its high, low, and close:
Typical price = (high + low + close) ÷ 3
VWAP = total of (typical price × volume) ÷ total volume
Both totals start from zero at the beginning of the period.
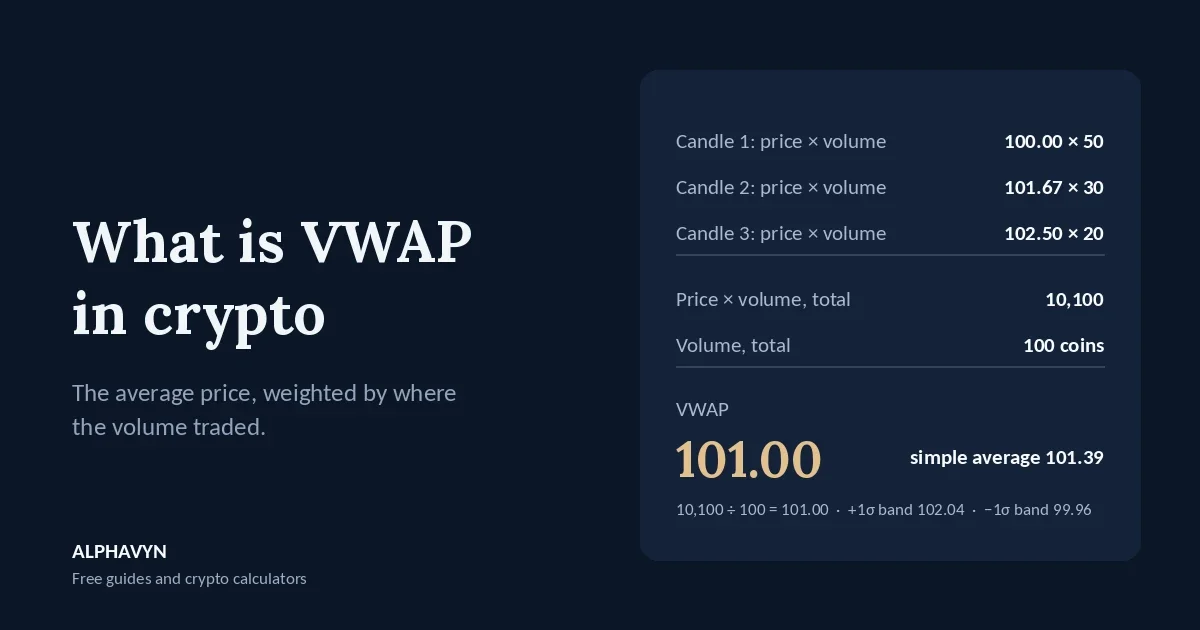
Example: three candles since the start of the day.
Candle | High | Low | Close | Typical price | Volume | Price × volume |
|---|---|---|---|---|---|---|
1 | 101 | 99 | 100 | 100.00 | 50 | 5,000 |
2 | 103 | 100 | 102 | 101.67 | 30 | 3,050 |
3 | 104 | 101 | 102.5 | 102.50 | 20 | 2,050 |
Total | 100 | 10,100 |
VWAP = 10,100 ÷ 100 = 101.00
Now compare a simple average of the three typical prices: (100 + 101.67 + 102.5) ÷ 3 = 101.39.
VWAP is lower because half of all the volume traded in the first candle, near 100. The simple average ignores that; VWAP doesn’t. The price has since risen to 102.50, but most coins changed hands lower.
Your chart does this automatically for every candle. The example just shows what the line represents: the average price paid per coin since the period started.
What do daily, weekly, and monthly VWAP mean?
Because VWAP restarts, the period you choose changes what it tells you:
Period | What it shows | Common use |
|---|---|---|
Day | The average traded price since the day started | Intraday trading on 5-minute to 1-hour charts |
Week | The average since the week started | Swing trades over several days |
Month | The average since the month started | A broader view of where the month’s trading has centered |
Stock markets have an opening and closing bell, so VWAP starts with each trading session. Crypto trades nonstop, so the start of the day has to be chosen. On our free live crypto charts, VWAP can start again each Day, Week or Month. The default, Auto, starts each UTC day again on intraday charts and covers all loaded candles on daily charts.
One thing to keep in mind: right after a reset, VWAP is built from only a few candles, so it can jump around. It becomes steadier as the period fills with volume.
The UTC day starts at the same moment as the Asia session, as our guide to the best time to trade crypto explains.
What does it mean when the price is above or below VWAP?
VWAP is the average price paid per coin over the period, so the price’s position against it gives a quick read:
Price above VWAP: the coin is trading above the period’s average. Buyers have been willing to pay more than most traders paid earlier in the period.
Price below VWAP: the coin is trading below the period’s average. Sellers have been willing to accept less.
In the example, the price at 102.50 is about 1.5% above the VWAP of 101.00.
Many intraday traders use this as a filter. In an up day, the price often stays mostly above VWAP, and dips toward it are where buyers step back in. In a down day, the price often stays mostly below it, and rallies toward it are where sellers step back in. A price that keeps crossing VWAP back and forth shows a day without a clear direction.
Can VWAP act as support or resistance?
Often, yes, especially on intraday charts. Because VWAP marks the average price where most volume traded, many traders watch it, and reactions near it are common:
In a rising day, a pullback to VWAP that holds can show buyers defending the average.
In a falling day, a bounce that stalls at VWAP can show sellers defending it.
A clear move through VWAP, with a candle closing on the other side, can show the balance of the day has shifted.
As with any level, treat VWAP as a zone, not an exact price, and look at where candles close. Our beginner’s guide to support and resistance explains why levels work as zones, and our guide on how to read crypto candlestick charts explains why the close matters more than the wick.
VWAP carries more weight when it lines up with something else on the chart, such as a horizontal support zone or a key moving average.
What are VWAP bands?
VWAP bands are lines drawn a set number of standard deviations above and below VWAP. They work much like Bollinger Bands, but around VWAP and weighted by volume. Our guide to Bollinger Bands in crypto explains standard deviation step by step.
In the example, the volume-weighted standard deviation of the three typical prices around the VWAP of 101.00 is about 1.04:
Candle 1: (100.00 − 101.00)² × 50 = 50.00
Candle 2: (101.67 − 101.00)² × 30 = 13.33
Candle 3: (102.50 − 101.00)² × 20 = 45.00
Total 108.33 ÷ total volume 100 = 1.0833, and √1.0833 ≈ 1.04
That puts the bands at:
Band | Level |
|---|---|
+2 standard deviations | 103.08 |
+1 standard deviation | 102.04 |
VWAP | 101.00 |
−1 standard deviation | 99.96 |
−2 standard deviations | 98.92 |
The price at 102.50 sits between the +1 and +2 bands: clearly above the day’s average, but not at an extreme.
Traders use the bands to judge how stretched the price is from the average. In a quiet market, moves to the outer bands often drift back toward VWAP. In a strong trend, the price can stay near or beyond an outer band for a long time, just as it can ride a Bollinger Band. On our chart, you can add bands at 1, 2, or 3 standard deviations.
How is VWAP different from a moving average?
VWAP | Moving average | |
|---|---|---|
Weighting | By volume | Equal (SMA) or by recency (EMA, WMA, HMA) |
Look-back | From the start of the period; restarts | A fixed number of candles; never restarts |
Best on | Intraday charts, with daily, weekly or monthly resets | Any timeframe |
Shows | The average price paid per coin in the period | The average closing price over the last candles |
They answer different questions. A moving average tells you the recent trend of closing prices. VWAP tells you where the period’s trading was centered. Many traders use both on the same chart. Our guide to moving averages in crypto explains the moving average side.
How do traders use VWAP to judge their own entries?
In stock markets, large traders often compare their average buy or sell price with VWAP: buying below VWAP means paying less than the average for the period, and buying above it means paying more.
You can use the same idea for your own trades. If your entry is far above the day’s VWAP after a sharp move, you’re paying well above where most of the day’s coins traded, which often means a wider stop and a weaker reward-to-risk. Entering with a limit order near a level, rather than chasing with a market order, helps keep your entry closer to the average. Our guide to market vs limit orders in crypto explains the difference.
What are the limits of VWAP?
It’s unsteady right after a reset. With only a few candles, VWAP can swing sharply.
It’s less useful on higher timeframes. On daily and weekly charts, VWAP depends on how many candles are included. Moving averages and horizontal levels usually tell you more there.
It doesn’t predict direction. VWAP describes where trading happened. It says nothing about where the price will go.
Volume on small coins can be misleading. Low-volume pairs can have a few large trades that pull VWAP sharply.
What does VWAP look like on a real chart?
Here is a weekly VWAP with bands at 2 standard deviations on the BTC/USDT 4-hour chart at 06:56 UTC on 17 October 2026, with the price at 81,620. The label reads:
VWAP (Week, bands 2) VWAP: 82,389.28 +1: 83,282.98 −1: 81,495.58 +2: 84,176.69 −2: 80,601.87 +3: n/a −3: n/a
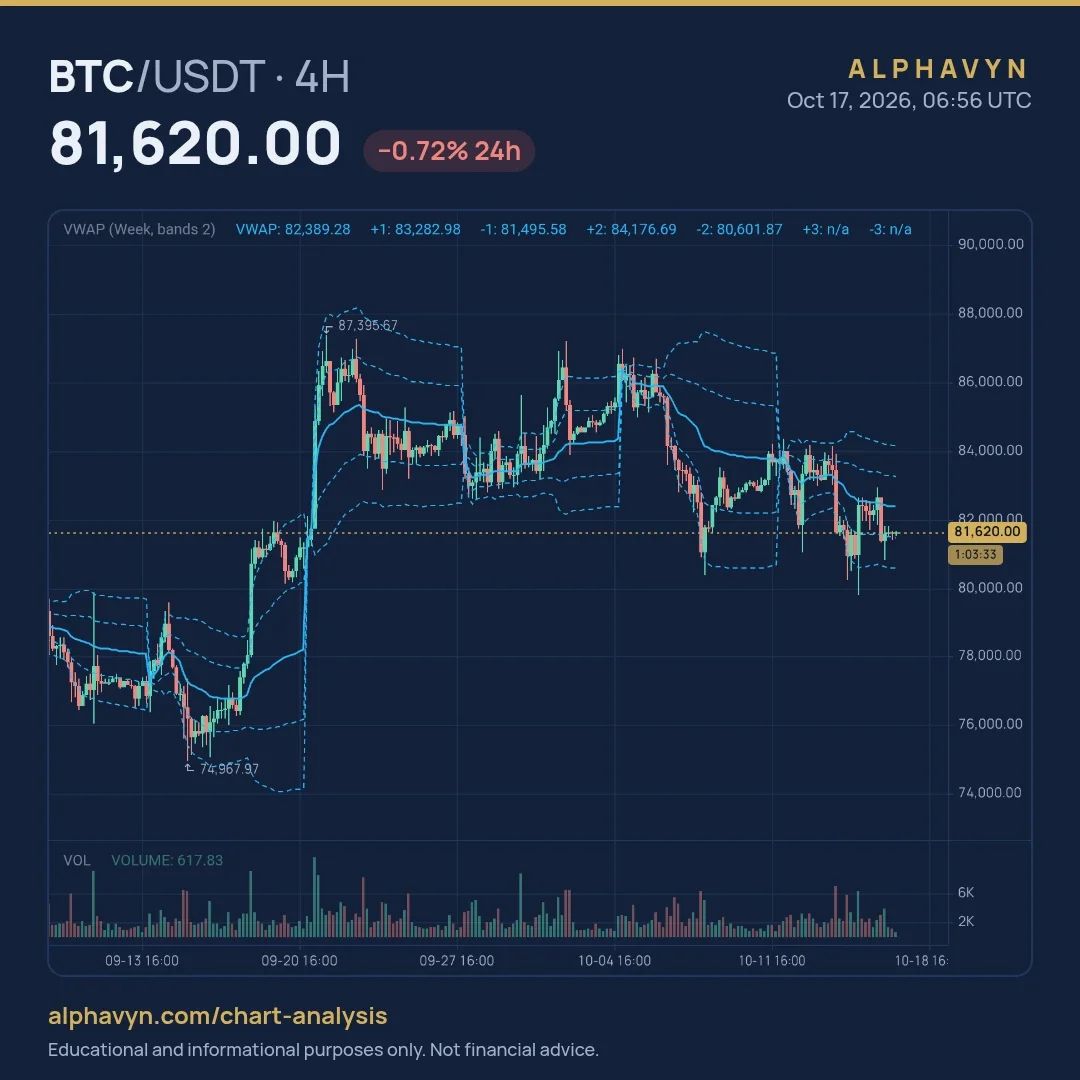
The bands are set to 2, so the chart shows the ±1 and ±2 bands, and the ±3 values read “n/a”. Each band sits 893.70 further from VWAP than the one before it, so one volume-weighted standard deviation this week was about 894.
The price, at 81,620, was 769.28 below the weekly VWAP, about 0.9%, and just above the −1 band. BTC was trading below the week’s average traded price, but not at an extreme.
The chart also shows how weekly VWAP behaves over time:
It restarts every week. Each new week, VWAP and its bands start again, which is why the lines jump at the start of each week.
It’s jumpy early in the week. In the week that started on 21 September, BTC rose from around 78,000 to 87,395.67 in its first days. With little volume counted yet, VWAP jumped up with the price, then settled around 85,000 as the week went on, while the price drifted back toward it.
It shows which side is in control. In the week that started on 5 October, the price opened near 86,000, fell through VWAP, and spent most of the week below it, reaching the lower band near 80,500.
The outer bands aren’t limits. In the week that started on 12 October, a sharp drop on 15 October produced a wick to about 79,800, below the −2 band, before the price recovered back toward VWAP.
How do I add VWAP on ALPHAVYN?
On our free live crypto charts, open Indicators and add VWAP. In its settings, choose when it starts again: Auto (each UTC day on intraday charts), Day, Week or Month, and add bands at 1, 2 or 3 standard deviations if you want them.
A good way to learn it: open a 15-minute or 1-hour chart of BTC/USDT, add a daily VWAP, and watch where the price reacts to it over a few days. Then switch to a weekly VWAP and compare.
What are common VWAP mistakes?
Using daily VWAP on daily candles. A daily VWAP on a daily chart is just one candle. Use intraday timeframes for daily VWAP.
Trusting VWAP right after a reset. Give it time to build up volume.
Buying every touch of VWAP. In a strong down day, VWAP can act as resistance again and again.
Using VWAP alone. It shows where trading is centered, not momentum or key levels. Combine it with trend, momentum, and support and resistance.
Frequently asked questions
What is a good timeframe for VWAP?
Daily VWAP works best on intraday charts, from about 5 minutes to 1 hour. Weekly and monthly VWAP can be useful on the 1-hour and 4-hour charts for trades that last several days.
Does VWAP work in crypto, since the market never closes?
Yes, but the start of each period has to be chosen, because there’s no opening bell. Many platforms, including ours, use UTC days. Different start times can give slightly different VWAP lines, so compare charts with the same setting.
Is price above VWAP bullish?
It shows the price is above the period’s average traded price, which is a sign of strength for that period. It’s not a buy signal on its own. A price above VWAP can still fall, especially near a strong resistance level. Crypto assets are volatile, and the U.S. SEC notes that the risk of loss remains significant.
What is the difference between VWAP and Volume Profile?
VWAP is a single line showing the average price weighted by volume over time. Volume Profile shows how much volume traded at each price level, as bars on the side of the chart. Both are built from volume, and you can add both on our free live crypto charts.
Open the free live crypto charts, add a daily VWAP to the 1-hour chart of a pair you follow, and note how the price behaved around it over the last few days. Then size any trade from your stop with the position size calculator.
Our guide to Volume Profile in crypto explains the POC and value area.