Many beginners judge a strategy by one number: how often it wins. But a strategy that wins 70% of the time can still lose money, and one that wins only 40% of the time can come out ahead. The difference is the risk/reward ratio. This guide explains what it is, how to calculate it, and how to use it, with examples you can check in the free risk/reward calculator.
What is the risk/reward ratio?
The risk/reward ratio compares two distances:
Risk: the distance from your entry to your stop loss, which is what you lose if the trade fails.
Reward: the distance from your entry to your take-profit target, which is what you gain if the trade works.
It is usually written as 1 :X, meaning "for every 1 unit I risk, I aim to make X." A ratio of 1:2 means the target is twice as far from the entry as the stop.
The ratio only makes sense if both levels are set before you enter. That is why it is one of the five parts of a complete crypto trade plan.
How do I calculate the risk/reward ratio?
Risk = entry − stop loss
Reward = target − entry
Ratio = reward ÷ risk, written as 1: X
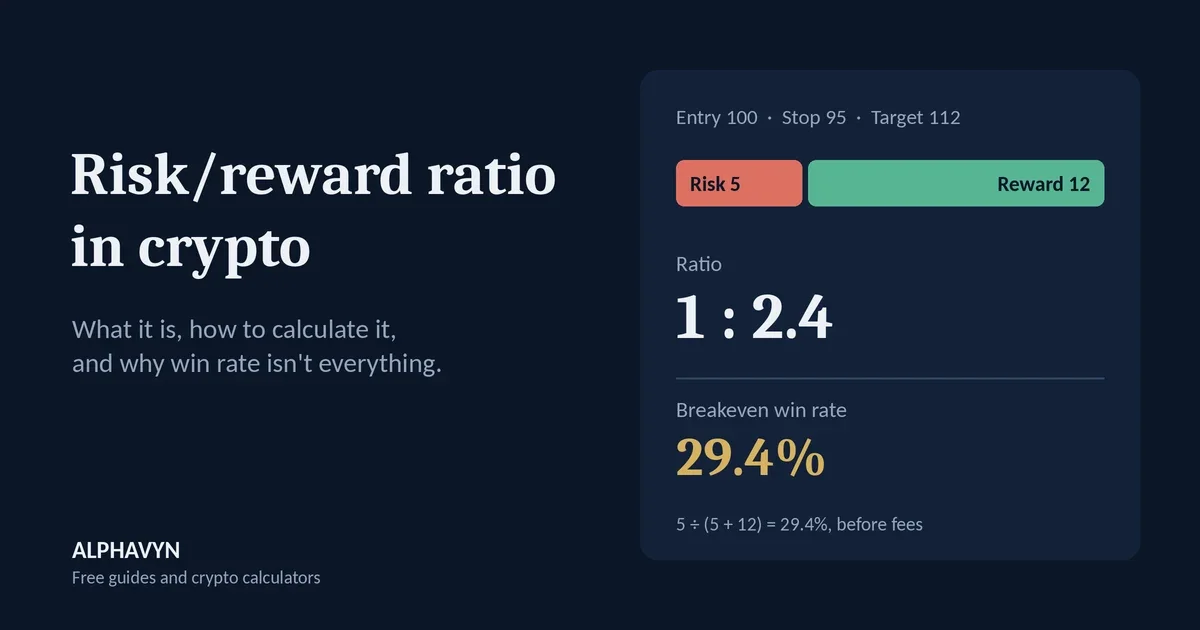
Example (Long): entry 100, stop loss 95, target 112.
Risk = 100 − 95 = 5
Reward = 112 − 100 = 12
Ratio = 12 ÷ 5 = 2.4, so 1: 2.4
For a Short, the levels flip: the stop is above the entry, and the target is below. With an entry of 50, a stop at 52 and a target at 45, the risk is 2, the reward is 5, and the ratio is 1: 2.5.
You can calculate the ratio on prices per coin, as above, or on the full position in USDT. The result is the same, because the position size multiplies both sides equally.
What is a breakeven win rate?
The breakeven win rate is the share of trades you need to win just to avoid losing money overall, before fees. If you win more often than this, the arithmetic is in your favor; if you win less often, it is not.
Breakeven win rate = risk ÷ (risk + reward)
In the example above: 5 ÷ (5 + 12) = 5 ÷ 17 = 29.4%. With a 1: 2.4 ratio, you would need to win a little under 3 trades out of 10 to break even.
How does the ratio change the win rate you need?
Risk/reward | Breakeven win rate (before fees) |
|---|---|
1: 1 | 50.0% |
1: 1.5 | 40.0% |
1: 2 | 33.3% |
1 : 3 | 25.0% |
1: 4 | 20.0% |
The higher the ratio, the more trades you can lose and still break even. The reverse is also true: with a ratio below 1: 1, for example risking 10 to make 5, you need to win more than two trades out of three just to break even.
Can a strategy that loses most trades still make money?
Yes, if the winners are large enough compared with the losers. Here is a simple calculation.
Imagine 100 trades, each risking 10 USDT, with a 1: 2 ratio (each win makes 20 USDT) and a 40% win rate:
Wins: 40 × 20 = 800 USDT
Losses: 60 × 10 = 600 USDT
Result: +200 USDT before fees
This strategy lost 60 of 100 trades and still ended ahead. Now compare a strategy with a 70% win rate but a 1: 0.3 ratio (risking 10 to make 3): 70 × 3 = 210 in wins, 30 × 10 = 300 in losses, a result of −90 USDT. A high win rate alone told you nothing.
This is arithmetic, not a promise. Real win rates change over time, and no ratio guarantees a profit. Crypto assets are volatile, and the U.S. SEC notes that the risk of loss remains significant.
How do fees change the picture?
Fees are paid on every trade, win or lose, so they work against you on both sides. In the 100-trade example, if each position is about 200 USDT and the fee is 0.1% per side, each round trip costs roughly 0.40 USDT. Over 100 trades, that is about 40 USDT, which turns +200 into roughly +160 USDT.
Slippage has a similar effect. A stop loss can fill at a worse price than planned in a fast market, as the U.S. SEC explains in its investor bulletin on stop orders, which makes the real risk slightly larger than the planned one. You can see the effect of fees on a single trade with the crypto profit calculator.
A market order can add slippage on the way in as well. Our guide to market vs limit orders in crypto shows how spread and slippage change your real entry price.
Why is a high ratio useless if the target is unrealistic?
It is easy to make the ratio look great on paper: just move the target further away. Entry 100, stop 95, target 125 gives a 1: 5 ratio and a breakeven win rate of only 16.7%. But if the price has been rejected at 108 several times, reaching 125 may be unlikely, and the real win rate could fall far below 16.7%.
The ratio and the win rate are linked. Far targets are reached less often; close targets are reached more often. A good ratio is one where the target sits at a level the price can realistically reach, such as the next clear resistance for a Long or the next support for a Short.
The same applies to the stop. Squeezing the stop very close to the entry improves the ratio, but a stop inside normal price swings gets hit more often. Our guide on where to place a stop loss in crypto covers how to choose a level that reflects the trade idea.
What about trades with two targets?
Many trade plans use two targets: close part of the position at TP1 and the rest at TP2. The overall ratio is then a blend of both.
Example: entry 100, stop 95, TP1 105 (1: 1) and TP2 110 (1: 2), closing half at each. If both targets are reached, the average reward is (5 + 10) ÷ 2 = 7.5 per coin, so the blended ratio is 1: 1.5.
How do I use the free risk/reward calculator?
The risk/reward calculator does the math for you:
Enter the entry price (100).
Enter the stop loss (95).
Enter the target (112).
It shows the ratio (1 : 2.4), the breakeven win rate (29.4%) and how far each level is from the entry in percent.
Once the ratio looks reasonable, decide how many coins to buy so the stop loss costs only what you chose to risk. Our guide on how to calculate position size in crypto explains the formula, and the position size calculator also shows the ratio when you add a take-profit.
Frequently asked questions
What is a good risk/reward ratio in crypto?
There is no single good number. Many traders look for at least 1: 1.5 or 1: 2, because it lowers the win rate needed to break even to 40% or 33.3%. But a ratio only helps if the target is realistic. A 1: 1.5 trade with a reachable target can be better than a 1: 4 trade with a target the price is unlikely to see.
Does the risk/reward ratio work for Shorts?
Yes. The formula is the same; only the direction of the levels changes. For a Short, risk is the stop minus the entry, and reward is the entry minus the target.
Are fees included in the ratio?
Usually not. The standard ratio is calculated from prices only. Fees and slippage reduce every win and increase every loss slightly, so the real ratio is a little worse than the one on paper.
Should I always aim for the highest ratio?
No. A very high ratio usually means a far target or a very tight stop, and both lower the chance of the trade working. The goal is a balance between a reachable target, a stop at a meaningful level, and a ratio that makes sense together with your real win rate.
Before your next trade, check the numbers in the risk/reward calculator so you know the ratio and the win rate you need before you enter.