Stochastic and Stochastic RSI have almost the same name, sit in similar panels, use the same 80 and 20 levels, and both draw a %K and a %D line. But they measure different things, and Stochastic RSI moves much faster. Mixing them up is one of the most common beginner mistakes with momentum indicators.
In this guide, we’ll go through how each one is calculated, how to read %K, %D and the levels, how they differ, and where they mislead, using a real BTC/USDT chart. You can add both to any USDT pair on our free live crypto charts and follow along.
What is the stochastic oscillator?
George Lane developed the stochastic oscillator in the 1950s. It answers one question: where did price close compared with its recent high-low range?
A reading near 100 means the close was near the top of the range.
A reading near 0 means the close was near the bottom of the range.
A reading near 50 means the close was in the middle.
The idea behind it is simple. In a rising market, closes tend to finish near the top of the recent range. In a falling market, they tend to finish near the bottom.
How is the stochastic oscillator calculated?
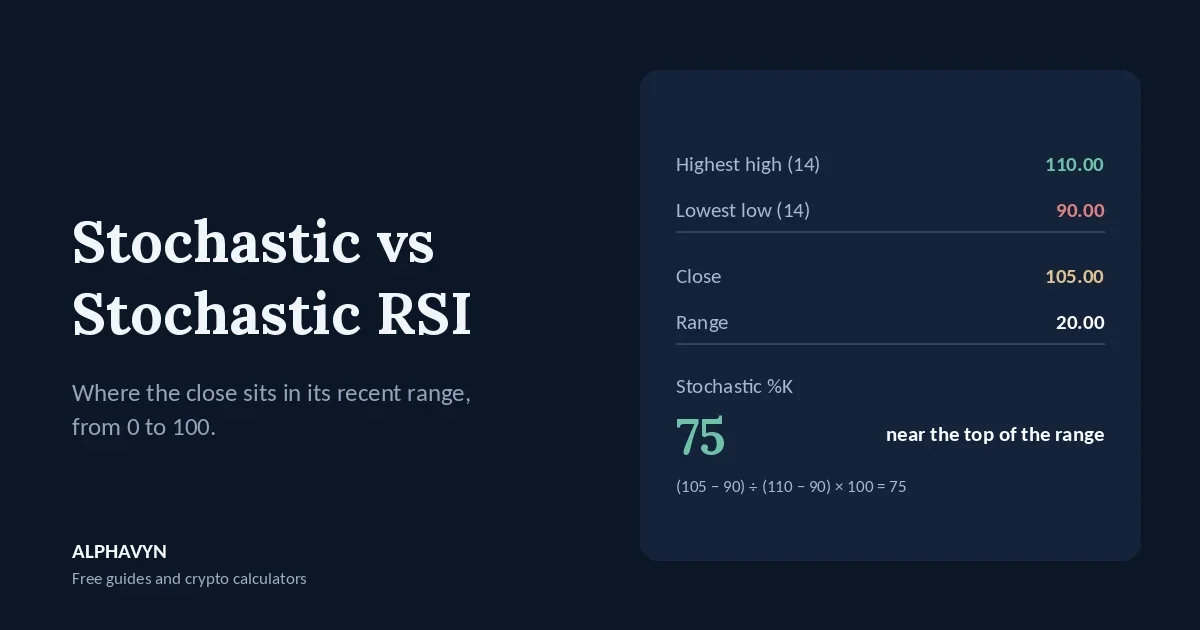
%K = (close − lowest low) ÷ (highest high − lowest low) × 100
The lowest low and highest high come from the last 14 candles by default.
Example: over the last 14 candles, the highest high was 110 and the lowest low was 90. The latest close is 105.
%K = (105 − 90) ÷ (110 − 90) × 100 = 15 ÷ 20 × 100 = 75
So the close sits three quarters of the way up the recent range.
The second line, %D, is a 3-period average of %K. If the last three %K readings were 66, 72 and 75:
%D = (66 + 72 + 75) ÷ 3 = 71
%D is smoother and slower than %K, a bit like a signal line.
What does %K smoothing mean?
Many charts let you smooth %K before %D is calculated:
%K smoothing of 1 means no extra smoothing. This is often called the fast stochastic. It reacts quickly and is jumpy.
%K smoothing of 3 averages %K over three candles first. This is often called the slow stochastic, and the setting is written as 14, 3, 3.
On our free live crypto charts, the default Stochastic setting is 14, 1, 3: a 14-candle range, no extra %K smoothing, and a 3-period %D. If you compare it with a chart that uses 14, 3, 3, the lines will look different. Neither is wrong. If you prefer the slower version, just set %K smoothing to 3.
What is Stochastic RSI?
Tushar Chande and Stanley Kroll introduced Stochastic RSI in 1994. It applies the stochastic formula to RSI instead of price, so it answers a different question: where is RSI now, compared with its own recent range?
Stoch RSI = (RSI − lowest RSI) ÷ (highest RSI − lowest RSI) × 100
Example: RSI is 55. Over the last 14 candles, the lowest RSI was 40 and the highest was 60.
Stoch RSI = (55 − 40) ÷ (60 − 40) × 100 = 15 ÷ 20 × 100 = 75
Notice what happened here. An RSI of 55 is ordinary, just above the middle. But compared with its own recent range, it’s near the top, so Stochastic RSI reads 75. That’s why Stochastic RSI reaches the extremes far more often than RSI itself. If RSI is new to you, our guide on how to use RSI in crypto explains how it works.
Stochastic RSI also has %K and %D lines: %K is a 3-period average of the raw reading, and %D is a 3-period average of %K. On our chart, the default setting is 14, 14, 3, 3: a 14-period RSI, a 14-period stochastic range, then 3 and 3 for the two averages.
What is the difference between Stochastic and Stochastic RSI?
Here’s the quick side-by-side:
Stochastic | Stochastic RSI | |
|---|---|---|
Built from | Price: the close, high and low | RSI |
Measures | Where the close sits in its recent range | Where RSI sits in its recent range |
Speed | Fast | Faster |
Reaches 80 or 20 | Fairly often | Very often, sometimes every few days |
Default on our chart | 14, 1, 3 | 14, 14, 3, 3 |
Think of Stochastic RSI as an indicator of an indicator, so it’s more sensitive. It shows small shifts in momentum early, but it also gives many more false turns. Many traders use Stochastic RSI for timing on shorter moves, and the regular Stochastic or RSI itself for the broader picture.
How do I read %K and %D?
Both indicators are read the same way:
Above 80: often called overbought. The close (or RSI) has been near the top of its recent range.
Below 20: often called oversold. It has been near the bottom.
%K crossing above %D: short-term momentum turning up.
%K crossing below %D: short-term momentum turning down.
Crossovers carry more weight when they happen at the extremes. A %K cross above %D below 20 shows momentum turning up from oversold, and a cross below %D above 80 shows it turning down from overbought. Crossovers in the middle of the scale are far less meaningful.
And as with RSI, overbought doesn’t mean “sell” and oversold doesn’t mean “buy”. In a strong trend, both indicators can stay near the extreme for a long time.
How do I read Stochastic and Stochastic RSI on the ALPHAVYN chart?
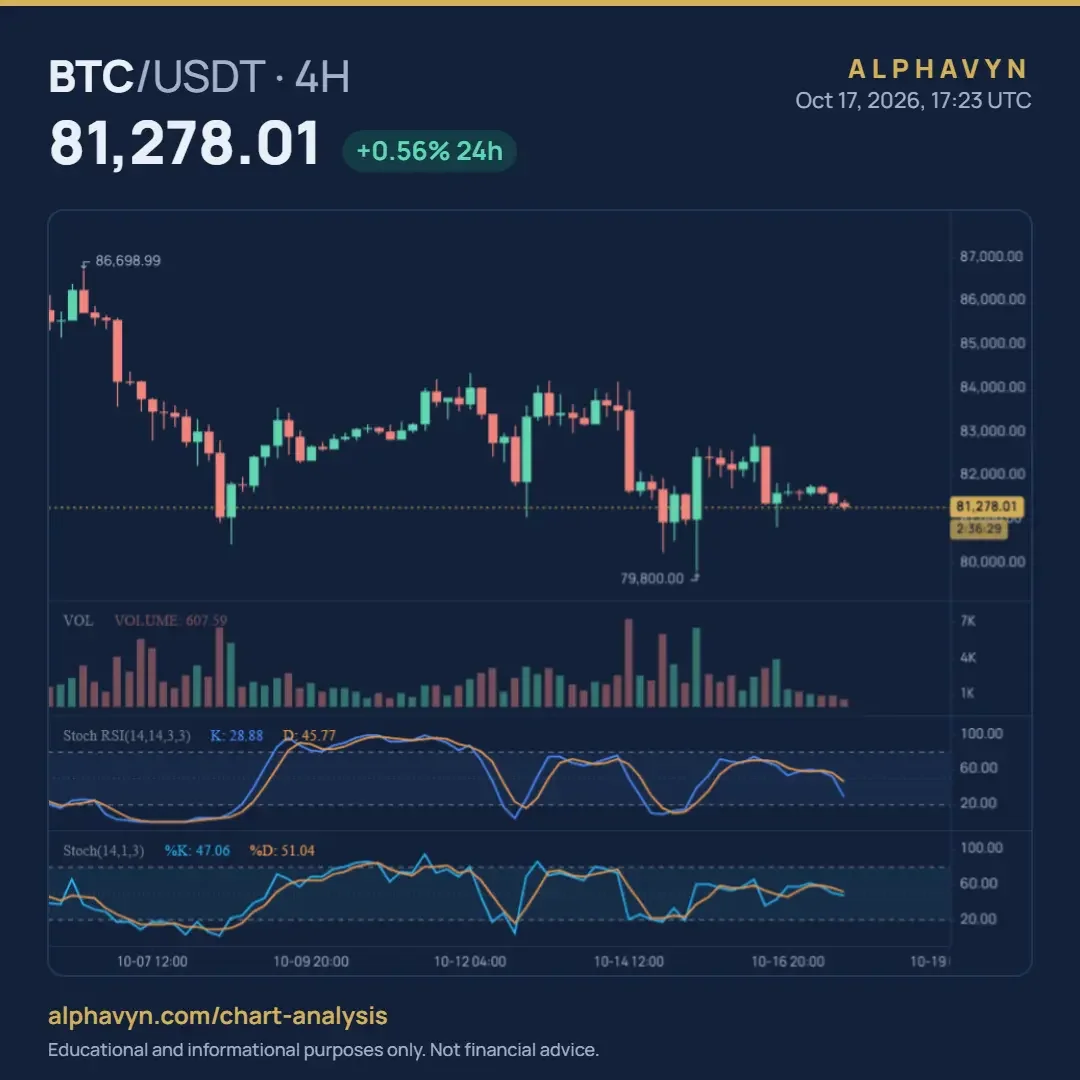
Let’s look at a real one. Here are both indicators on the BTC/USDT 4-hour chart at 17:20 UTC on 17 October 2026, with price at 81,268.01. The labels read:
Stoch RSI(14,14,3,3) K: 28.88 D: 45.77
Stoch(14,1,3) %K: 46.74 %D: 50.94
The two readings tell slightly different stories:
Stochastic RSI has %K at 28.88, well below %D at 45.77, and falling toward the 20 level. RSI is now near the lower part of its own recent range, and short-term momentum has turned down.
Stochastic has %K at 46.74 and %D at 50.94, both in the middle of the scale. The latest close sits near the middle of its 14-candle range.
Same price action, two different readings. That’s because Stochastic RSI reacts much faster to small changes.
The chart also shows the main lessons of both indicators:
They can stay oversold in a trend. As BTC fell from 86,698.99 between about 6 and 8 October, both indicators dropped to the bottom of the scale, and Stochastic RSI stayed near zero for many candles while price kept falling. Buying the first oversold reading would have meant buying early.
They can stay overbought in a slow rise. After the bounce, Stochastic RSI climbed above 80 around 10 October and stayed there for about two days while price edged up slowly.
Stochastic RSI swings more. Around 13 October and again around 15 October, when a wick reached 79,800, Stochastic RSI fell close to zero and then shot back up, while the regular Stochastic moved through a narrower range.
You can change every number in both indicators, as well as the upper and lower levels, in the indicator settings, and hide the levels if you prefer.
How do I use them with other tools?
Neither indicator shows trend direction or key levels, so they work best with other evidence:
Trend. In an uptrend, many traders only watch for oversold readings and upward crosses as signs a pullback may be ending, and ignore overbought readings. In a downtrend, it’s the reverse. Our guide to moving averages in crypto explains how to read the trend.
Levels. An upward cross below 20, as price holds a well-tested support zone, carries far more weight than one in the middle of nowhere. Our beginner’s guide to support and resistance explains how to find these zones.
Candles. A candle closing back above a level confirms what the indicator suggests. Our guide on how to read crypto candlestick charts explains why the close matters.
Other momentum indicators. When Stochastic, RSI and MACD agree, the momentum reading is clearer. Our guide on how to use MACD in crypto explains MACD.
If you want an oscillator that measures the distance from the average price instead, take a look at our guide to the CCI indicator in crypto.
And whatever the indicators show, the trade itself still needs a stop loss where the idea would be wrong, and a position sized so the stop costs only what you chose to risk. The position size calculator does that math for you.
Should I change the settings?
The defaults are a good place to start. Here’s what changing them does:
A shorter range (for example 9 instead of 14) makes both indicators faster and more jumpy.
A longer range (for example 21) makes them smoother and slower.
More %K smoothing on the Stochastic (3 instead of 1) gives the slow stochastic, with fewer false crosses.
Wider levels (for example 90 and 10) mean only the most extreme readings count as overbought or oversold. Some traders use these with Stochastic RSI, because it reaches 80 and 20 so often.
Here’s the important part: changing the settings doesn’t make the indicators more accurate. It only moves the trade-off between speed and false signals. Keep the same settings long enough to learn how they behave, and stick to the 4-hour and daily charts for clearer readings, because on 1-minute and 5-minute charts, both indicators flip constantly.
What are common mistakes?
Confusing the two indicators. Stochastic RSI reaches the extremes far more often than the regular Stochastic. A Stochastic RSI reading of 5 is much less unusual than a Stochastic reading of 5.
Selling every overbought reading and buying every oversold one. In trends, both can stay at the extreme for a long time.
Trading crosses in the middle of the scale. Crosses near 50 are mostly noise.
Comparing readings across different settings. A 14, 1, 3 Stochastic and a 14, 3, 3 Stochastic will show different numbers for the same chart.
Using them alone. They show short-term momentum only.
Frequently asked questions
Which is better, Stochastic or Stochastic RSI?
Neither is better. The regular Stochastic is based directly on price and moves at a more moderate pace. Stochastic RSI is faster and more sensitive, which helps spot small turns early but gives more false signals. Many traders start with the regular Stochastic and add Stochastic RSI once they know how it behaves.
What are the best Stochastic RSI settings?
The standard 14, 14, 3, 3 is the most widely used and a good starting point. If it reaches the extremes too often for your style, try wider levels such as 90 and 10, or a longer range.
Why does my Stochastic look different on another platform?
Usually because of the %K smoothing. Our default is 14, 1, 3 (fast), while many platforms default to 14, 3, 3 (slow). Set the same numbers on both, and the readings should match closely.
Are Stochastic indicators reliable in crypto?
They’re useful for reading short-term momentum, but no indicator is reliable on its own, and both give many false signals in strong trends. Keep in mind that crypto assets are volatile, and the U.S. SEC notes that the risk of loss remains significant.
Try it yourself
Open the free live crypto charts, add both Stochastic and Stochastic RSI to the 4-hour chart of a pair you follow, and compare how often each one reaches 80 and 20. Then check the same pair in the pair analyzer to see its momentum reading.