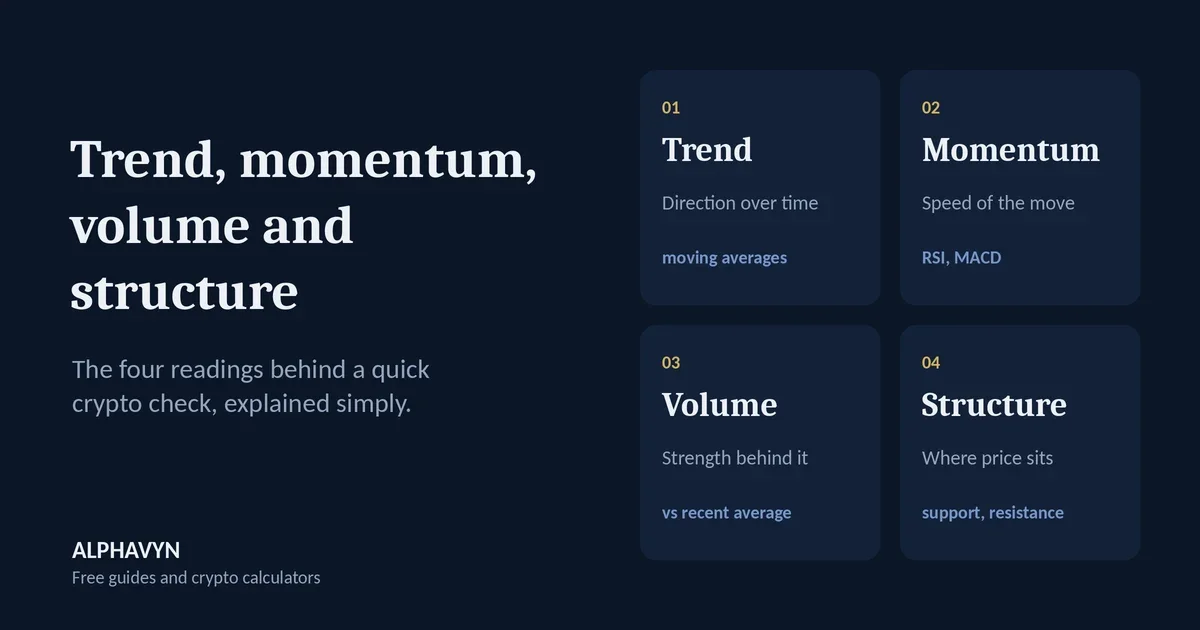
A chart can tell you many things at once, which is exactly why it can be confusing. A simple way to read it is to ask four separate questions: Which way is price going? How strongly? Is there real trading behind the move? And where does price sit right now?
Those four questions are trend, momentum, volume, and structure. The free pair analyzer shows all four for any USDT pair, and in this guide, we’ll use real BTC/USDT readings to explain each one.
Why look at four readings instead of one?
Each reading answers a different question, and each can be misleading on its own. A rising trend with fading volume may be running out of buyers. Strong momentum right under resistance may stall. Looking at all four together shows whether the evidence points the same way or not.
Here’s the BTC/USDT reading from ALPHAVYN’s pair analyzer on 9 October 2026, with price at 82,978.01:
Reading | Result | What the analyzer said |
|---|---|---|
Trend | Slightly positive (+3.0) | Price is above its short- and medium-term averages on 1H; on 4H, the medium-term average is above the long-term one |
Momentum | Positive (+14.1) | RSI is 58, above the midline; MACD is above its signal line |
Volume | Slightly negative (−4.6) | Latest 1H volume is 0.3x its recent average, on a falling candle |
Structure | Positive (+5.0) | Price is 0.7% above the nearest support (82,400.00); the nearest resistance (83,283.28) is 0.4% above |
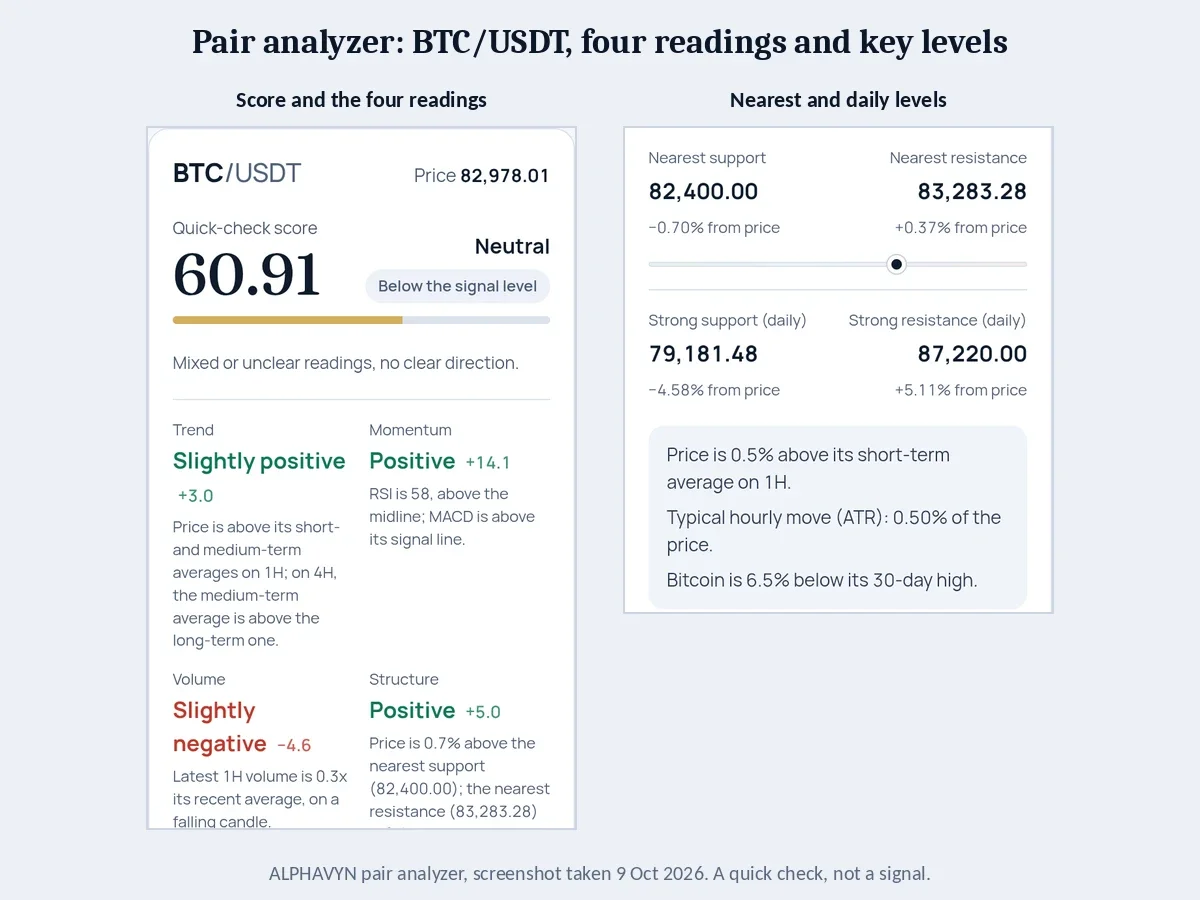
The overall quick-check score was 60.91, labeled Neutral, with the summary “mixed or unclear readings, no clear direction.” In the sections below, we’ll explain each reading and why they added up to Neutral.
What is trend?
Trend is the general direction of price over a period of time: up, down, or sideways. A common way to measure it is with moving averages, which smooth out price by averaging it over a number of candles.
When price is above its moving averages, and shorter averages are above longer ones, the trend is usually described as up.
When price is below them, and shorter averages are below longer ones, the trend is usually described as down.
Our guide to moving averages in crypto explains how SMA, EMA, WMA and HMA are calculated and which lengths traders watch.
Timeframes matter here. In the example, the trend is checked on both the 1-hour (1H) and 4-hour (4H) charts. Price was above its short- and medium-term averages on 1H, and on 4H the medium-term average was above the long-term one, so the trend reading was slightly positive.
What is momentum, and how is it different from trend?
Trend is the direction. Momentum is the strength or speed of the move. Think of a car driving north (that’s the trend) while slowing down (that’s the momentum). In markets, momentum often changes before the trend does, which is why traders watch both.
Two common momentum tools appear in the example:
RSI (Relative Strength Index) compares recent gains with recent losses on a scale from 0 to 100. Above 50, gains have been stronger than losses. Readings above 70 are often called overbought and below 30 oversold, as StockCharts’ ChartSchool explains. In the example, RSI was 58: above the midline, but not stretched. For a deeper look at overbought, oversold and divergence, see our guide on how to use RSI in crypto.
MACD compares two moving averages of different lengths. When the MACD line is above its signal line, upward momentum has been building. Our guide on how to use MACD in crypto explains crossovers, the zero line and the histogram.
Both were pointing up, so momentum was the strongest reading in the example, at +14.1.
To look at these readings yourself, add RSI, MACD and volume on our free live crypto charts.
What does volume tell you?
Volume is how much of the coin was traded in a period. It shows how much participation stands behind a price move. A rise on high volume suggests many traders are buying, while a rise on low volume can be fragile.
A useful way to read volume is to compare it with its recent average. In the example, the latest 1-hour volume was 0.3x its recent average, meaning only about 30% of a normal hour’s trading, and it came on a falling candle. Quiet trading during a small drop isn’t a strong signal either way, which is why the reading was only slightly negative.
If terms like “falling candle” or “wick” are new to you, our guide on how to read crypto candlestick charts explains what each part of a candle shows.
What is market structure?
Structure describes where price sits relative to important levels, such as support below and resistance above. It answers a simple question: is there room to move, or is price pressed against a level?
The analyzer shows two sets of levels. On 9 October, they were:
Level | Price | Distance from price |
|---|---|---|
Nearest support | 82,400.00 | −0.70% |
Nearest resistance | 83,283.28 | +0.37% |
Strong support (daily) | 79,181.48 | −4.58% |
Strong resistance (daily) | 87,220.00 | +5.11% |
The nearest levels are close and matter for short-term moves. The daily levels are further away and are watched by more traders. Our beginner’s guide to support and resistance explains how these levels form and why they often flip roles.
How does volatility change how you read the levels?
The analyzer also showed that Bitcoin’s typical hourly move (ATR) was 0.50% of price. ATR, or Average True Range, measures how much a coin usually moves in one period.
That puts the levels in context. The nearest resistance was only 0.37% above price, less than one typical hourly move, so price could reach it within an ordinary hour. The daily levels, about 4.6% and 5.1% away, were roughly nine to ten typical hourly moves away.
This is also useful for stop losses. A stop placed closer than one typical move is likely to be hit by normal noise. Our guide on where to place a stop loss in crypto explains how traders use ATR to set stops.
Why was the overall reading “Neutral”?
Three readings leaned positive, but they weren’t equally strong, and volume pointed the other way. The trend was only slightly positive, trading was quiet, and price was sitting just under the nearest resistance. Put together, the evidence didn’t point clearly in one direction, so the analyzer labeled it Neutral and showed it as below its signal level.
One important thing to keep in mind: the pair analyzer is a simplified, single-moment check to support your own research. ALPHAVYN’s published signals come from a much deeper process that looks at far more data and must pass several checks, so a score in the analyzer is not a signal and not a reason to open a trade. You can read more on the methodology page.
How quickly can the readings change?
Quickly. Here’s the same BTC/USDT check on three days in a row:
8 October 2026 | 9 October 2026 | 10 October 2026 | |
|---|---|---|---|
Price | 82,490.49 | 82,978.01 | 82,770.19 |
Score and label | 38.15, Bearish | 60.91, Neutral | 59.75, Neutral |
Trend | Negative (−19.0) | Slightly positive (+3.0) | Slightly positive (+3.0) |
Momentum | Slightly negative (−3.2) | Positive (+14.1) | Positive (+12.1) |
Volume | Slightly negative (−1.7) | Slightly negative (−4.6) | Slightly negative (−4.4) |
Structure | Positive (+5.0) | Positive (+5.0) | Positive (+5.0) |
Look at 8 to 9 October: price moved less than 0.6%, but the trend and momentum readings changed enough to move the score from Bearish to Neutral.
The levels changed too. On 10 October, the nearest resistance had moved down to 82,776.01, just 0.01% above price, and the strong daily resistance was 82,850.00, only 0.10% away, instead of 87,220.00 the day before. With a typical hourly move of 0.32%, price was pressed right against resistance. Volume was even quieter, at 0.1x its recent average.
Readings describe the market at one moment, not a forecast. That’s why it makes sense to check a pair again right before planning a trade.
Frequently asked questions
Which reading matters most?
None on its own. Trend tells you the direction to favor, momentum tells you whether the move is strengthening or fading, volume tells you whether there is real participation, and structure tells you whether there is room to move. The clearest pictures are the ones where most readings agree.
Can momentum be positive while the trend is negative?
Yes, and it’s common at turning points. A falling trend with rising momentum can mean the selling is slowing down. It doesn’t mean the trend has reversed yet, so many traders wait for the trend to confirm before acting.
What does “below the signal level” mean on the pair analyzer?
It means the quick-check score is in a range the analyzer treats as below its signal level. But the pair analyzer is not ALPHAVYN’s signal engine. It’s a simplified reading to support your own research, while published signals come from a deeper process with more data and several checks. A score in the analyzer is not a signal and not a reason to open a trade.
Do these readings predict the price?
No. They describe the market at the moment you check. Prices can change direction at any time, and crypto assets are volatile. The U.S. SEC notes that the risk of loss remains significant.
Try it yourself
Check any USDT pair in the free pair analyzer, and see whether trend, momentum, volume and structure agree. And when you plan a trade, set the stop loss first and size the position with the position size calculator.