MACD is one of the most popular indicators in crypto, and one of the busiest-looking: two lines, a row of bars, and a zero line, all moving at once. Once you know what each part measures, it becomes one of the clearest ways to see whether momentum is building or fading. This guide explains how MACD is calculated, how to read crossovers, the zero line and the histogram, and where MACD tends to mislead. You can add MACD to any USDT pair on our free live crypto charts and follow along.
What is MACD?
MACD stands for Moving Average Convergence Divergence. It was developed by Gerald Appel in the late 1970s, and the histogram was added later by Thomas Aspray. Like RSI, it’s a momentum indicator: it shows how strongly the price has been moving, not where it will go.
MACD has three parts:
Part | Also called | What it is |
|---|---|---|
MACD line | DIF | The 12-period EMA minus the 26-period EMA |
Signal line | DEA | A 9-period EMA of the MACD line |
Histogram | MACD bars | The gap between the MACD line and the signal line |
The standard settings are written as MACD (12, 26, 9). If exponential moving averages are new to you, our guide to moving averages in crypto explains how they’re calculated.
How is MACD calculated?
MACD line = 12-period EMA − 26-period EMA
Signal line = 9-period EMA of the MACD line
Histogram = MACD line − signal line
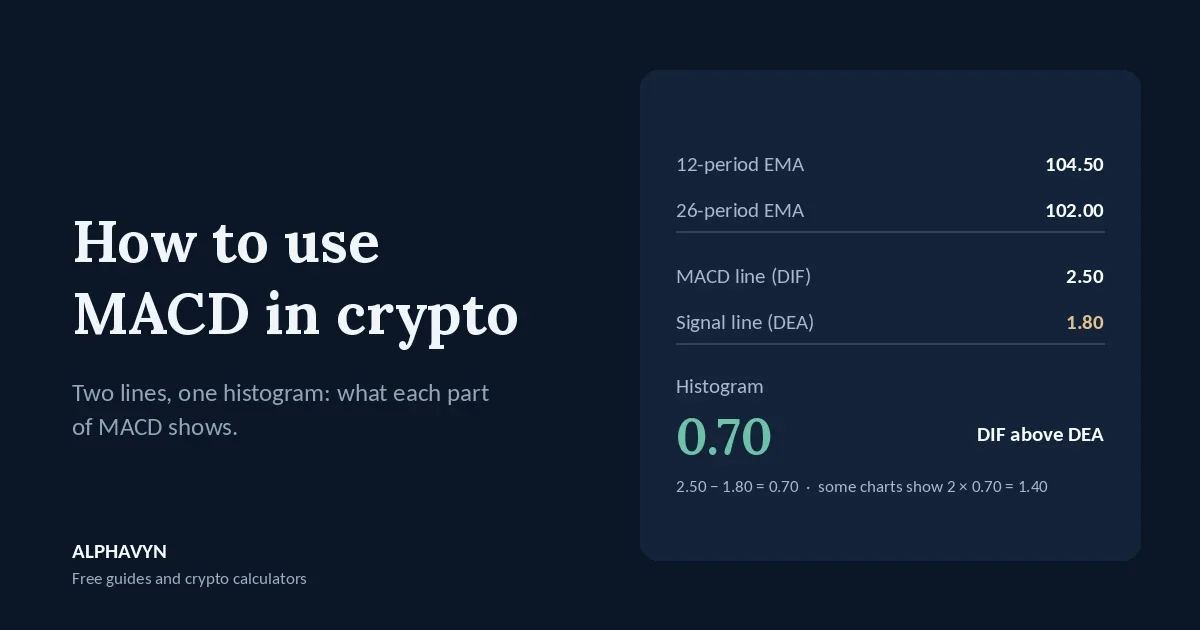
Example: the 12-period EMA is 104.50 and the 26-period EMA is 102.00.
MACD line = 104.50 − 102.00 = 2.50
Say the signal line, the 9-period average of recent MACD values, is 1.80
Histogram = 2.50 − 1.80 = 0.70
A positive MACD line means the faster average is above the slower one, so recent prices have been rising faster than the longer-term average. A positive histogram means the MACD line is above its own average, so that upward momentum has been increasing.
Your chart calculates all of this automatically. The formula just shows what each line actually measures.
Why are MACD values so different between coins?
MACD is measured in the same units as the price. Bitcoin near 82,000 can have a MACD line of around −326, while a coin priced near 1 might have a MACD line of 0.002. Both readings can describe the same strength of momentum.
That’s why you can’t compare MACD numbers across coins, or say that a MACD of 50 is “high”. What matters is the reading compared with its own recent history on the same chart: is the line above or below zero, above or below the signal line, and are the bars growing or shrinking?
How do I read MACD on the ALPHAVYN chart?
On our free live crypto charts, MACD appears in its own panel below the price and volume. Here is the BTC/USDT 4-hour chart at 04:00 UTC on 16 October 2026, with the price at 82,058. The MACD label reads:
MACD(12,26,9) DIF: −325.9646 DEA: −332.5432 MACD: 13.1572
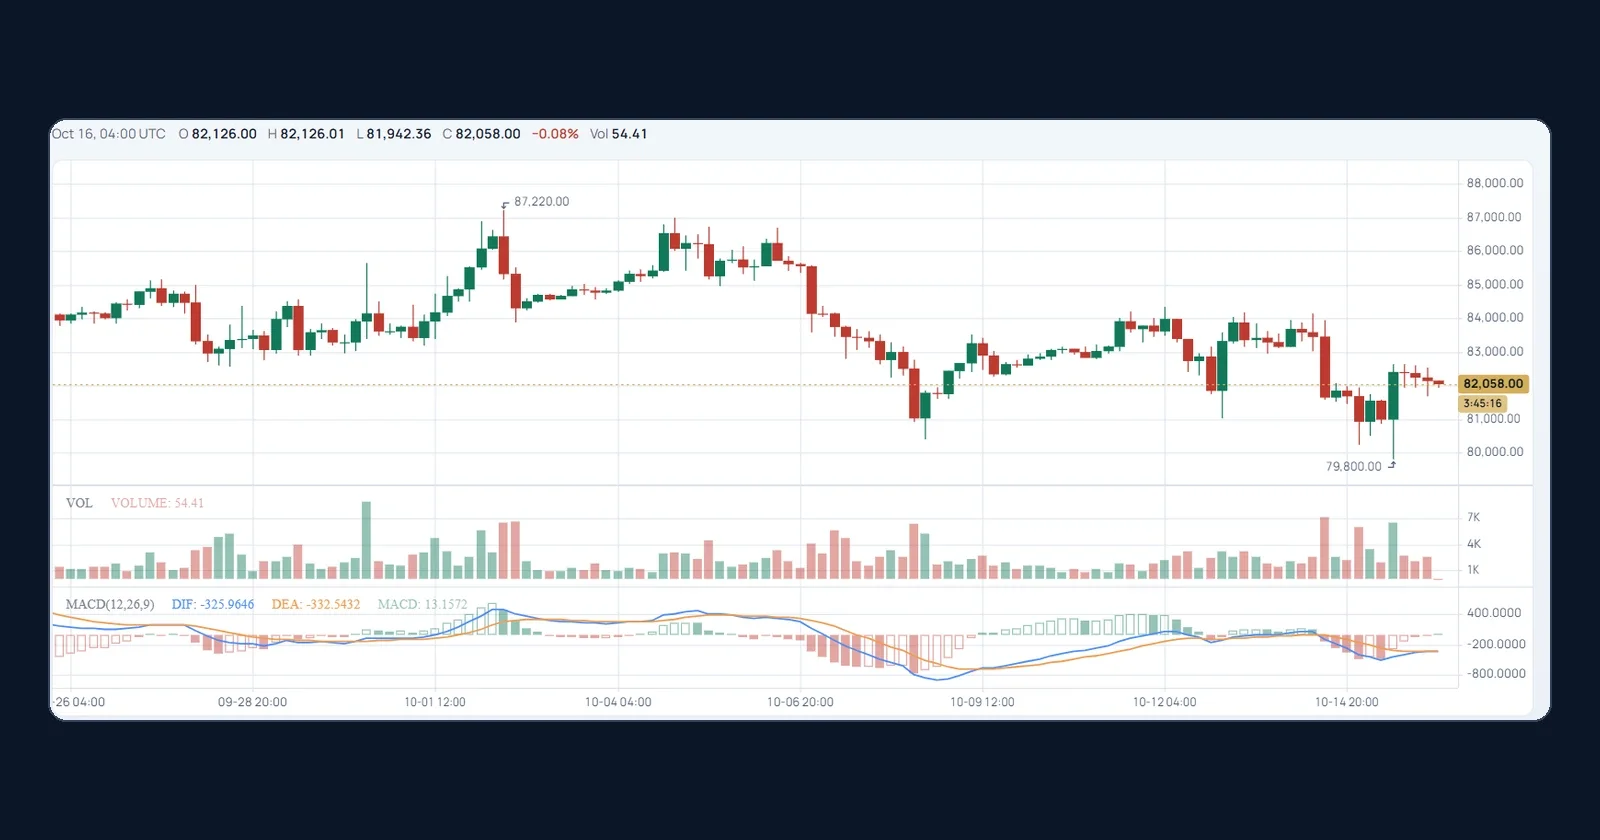
DIF is the MACD line.
DEA is the signal line.
MACD is the histogram value.
One detail matters here. The histogram value on our chart is twice the gap between DIF and DEA, a convention used by many charting tools:
DIF − DEA = −325.9646 − (−332.5432) = 6.5786
2 × 6.5786 = 13.1572
The doubling only makes the bars easier to see. It doesn’t change their direction or where they cross zero, so you read them the same way: positive bars when DIF is above DEA, negative bars when it’s below.
In this reading, both lines are below zero, which shows momentum has been negative over the period. But DIF has just moved above DEA, and the histogram has turned positive, which shows the downward momentum is weakening. That’s an early change, not a confirmed reversal.
The chart also shows how MACD behaved over the previous weeks. When Bitcoin fell from around 86,000 to near 80,500 between 6 and 8 October, MACD dropped well below zero with large red bars. The bars began shrinking while the price was still near the low, and the lines crossed back up soon after, a few candles before the rebound toward 84,000. The same pattern appeared again on 14 and 15 October, after the drop that briefly reached 79,800 with a long lower wick.
You can change the settings from the default 12, 26 and 9 using the settings button next to MACD in the indicator list.
What does a MACD crossover mean?
The most watched MACD event is the crossover between the MACD line and the signal line:
Bullish crossover: the MACD line crosses above the signal line. The histogram turns from negative to positive.
Bearish crossover: the MACD line crosses below the signal line. The histogram turns from positive to negative.
Where the crossover happens matters:
A bullish crossover below zero, like the reading above, shows that falling momentum is slowing. It often comes early, and many fail.
A bullish crossover above zero shows momentum turning up again inside an existing uptrend.
The same applies in reverse for bearish crossovers. Like any signal built from moving averages, crossovers lag the price. By the time the lines cross, part of the move has usually already happened.
What does the zero line tell you?
The zero line shows when the MACD line changes sign:
MACD line above zero: the 12-period EMA is above the 26-period EMA. Shorter-term momentum is positive.
MACD line below zero: the 12-period EMA is below the 26-period EMA. Shorter-term momentum is negative.
A MACD line crossing zero is the same event as the 12-period EMA crossing the 26-period EMA on the price chart. It’s slower than a signal-line crossover, but it’s a broader sign that momentum has shifted.
How do I read the MACD histogram?
The histogram is often the most useful part of MACD, because it changes before the lines cross.
When the histogram bars grow, the gap between the MACD line and the signal line is widening, and momentum is strengthening in that direction. When the bars shrink, the gap is closing, and momentum is fading, even if the price is still moving the same way.
Example: over six candles, the histogram reads 0.90, 1.20, 1.40, 1.10, 0.70 and 0.30.
The bars grew for three candles, so upward momentum was building.
They peaked at 1.40, then started shrinking.
If they keep shrinking and cross below zero, that’s a bearish crossover.
Shrinking bars don’t mean the price must turn. A strong trend can pause, let momentum cool, then continue. But shrinking bars are an early warning that the current push is losing strength.
What is MACD divergence?
Divergence works the same way as with RSI: the price and the indicator disagree.
Example: the price makes a high at 110, and the MACD line peaks at 3.20. After a pullback, the price makes a new high at 115, but this time the MACD line only reaches 2.10. The price went higher, but momentum behind it was weaker. That’s bearish divergence. The reverse, a lower low in price with a higher low in MACD, is bullish divergence.
As with RSI, divergence is a warning, not a timing signal. It can last for a long time before anything happens. Our guide on how to use RSI in crypto explains why many traders wait for the price itself to confirm.
Why does MACD fail in sideways markets?
MACD is built from moving averages, so it shares their main weakness. When the price moves sideways, the two EMAs flatten and stay close together. The MACD line hovers around zero, and it crosses the signal line again and again in both directions.
Example: a coin moves between 95 and 105 for several weeks. MACD crosses its signal line eight times, and each crossover is followed by a move in the opposite direction within a few candles. A trader taking every crossover would pay fees on eight small losses.
The warning sign is a MACD line stuck near zero with tiny histogram bars. In that situation, horizontal support and resistance usually tell you more. Our beginner’s guide to support and resistance explains how to find them.
Should I change the MACD settings?
The default 12, 26 and 9 are by far the most widely used, so they’re the readings most traders watch. They’re a good place to start.
You can change them on our chart:
Shorter settings react faster, so crossovers come earlier, but there are more false ones.
Longer settings react slower and give fewer crossovers, but each one comes later.
Changing the settings doesn’t make MACD more accurate. It only moves the trade-off between speed and false signals. Keep the same settings long enough to learn how they behave on the coins and timeframes you trade, and avoid changing them just to make a past chart look right.
On timeframes, MACD on 1-minute or 5-minute charts crosses constantly. Most beginners get clearer readings on the 4-hour and daily charts.
How do I use MACD with other tools?
MACD works best as one piece of evidence among several:
Trend: a bullish MACD crossover above zero, with the price above a rising 50-period moving average, is stronger than a crossover against the trend.
Levels: a bullish crossover as the price holds a support zone carries more weight than one in the middle of a range.
Candles: a candle closing back above a level confirms what MACD suggests. Our guide on how to read crypto candlestick charts explains why the close matters.
RSI: MACD and RSI both measure momentum, so when they agree, the momentum reading is clearer.
Our guide to trend, momentum, volume and structure shows how these readings fit together, and the pair analyzer uses MACD together with RSI in its momentum reading. The analyzer is a quick check to support your own research, not a signal.
Whatever MACD shows, the trade itself still needs a stop loss where the idea would be wrong, and a position sized so the stop costs only what you chose to risk, using the position size calculator.
What are common MACD mistakes?
Taking every crossover. In sideways markets, most crossovers fail.
Comparing MACD values between coins. MACD is in price units, so the numbers aren’t comparable.
Ignoring where the crossover happens. A bullish crossover far below zero is much weaker than one near or above zero in an uptrend.
Acting on divergence alone. Divergence can last for many candles.
Using MACD on its own. It shows momentum only, not where support and resistance are.
Frequently asked questions
What are the best MACD settings for crypto?
There’s no single best setting. The standard 12, 26 and 9 is the most widely used and a good starting point. Shorter settings react faster with more false signals; longer settings are slower with fewer. Pick one setting and learn how it behaves before adjusting it.
What do DIF and DEA mean?
They’re the names many charting tools use for MACD’s two lines. DIF is the MACD line, the difference between the 12-period and 26-period EMAs. DEA is the signal line, a 9-period average of DIF.
Why is the MACD histogram value different from DIF minus DEA?
Many charting tools, including ours, show the histogram as twice the gap between DIF and DEA. In the BTC/USDT example above, DIF − DEA is 6.5786 and the histogram shows 13.1572. The direction and the zero crossings are the same either way.
Is MACD reliable in crypto?
It’s useful for reading momentum, but no indicator is reliable on its own. MACD lags the price and gives many false signals when the market moves sideways. Crypto assets are volatile, and the U.S. SEC notes that the risk of loss remains significant.
Open the free live crypto charts, add MACD to the 4-hour chart of a pair you follow, and watch how the histogram grows and shrinks before each crossover. Then check the same pair in the pair analyzer to see its momentum reading.