RSI is one of the first indicators most crypto traders add to a chart, and one of the most misread. Plenty of beginners sell the moment it crosses 70 or buy the moment it drops below 30, then watch price keep going the same way. RSI is genuinely useful, but only when you know what it measures and where it tends to fail.
In this guide, we’ll go through how RSI works, how to read it on a real BTC/USDT chart, and how to combine it with the levels on your chart. You can add RSI to any pair on our free live crypto charts and follow along.
What is RSI?
RSI stands for Relative Strength Index. J. Welles Wilder introduced it in 1978, and it’s a momentum indicator: it doesn’t tell you the direction of the trend, but how strong the recent moves have been.
It moves on a scale from 0 to 100:
Above 50: recent gains have been larger than recent losses.
Below 50: recent losses have been larger than recent gains.
Near the extremes: one side has been in control for most of the recent candles.
The standard setting looks back over 14 candles. On a daily chart, that’s 14 days. On a 4-hour chart, it’s 14 four-hour candles, about two and a half days.
Momentum is only one part of the picture, though. Our guide to trend, momentum, volume and structure shows how RSI fits next to the other readings.
How is RSI calculated?
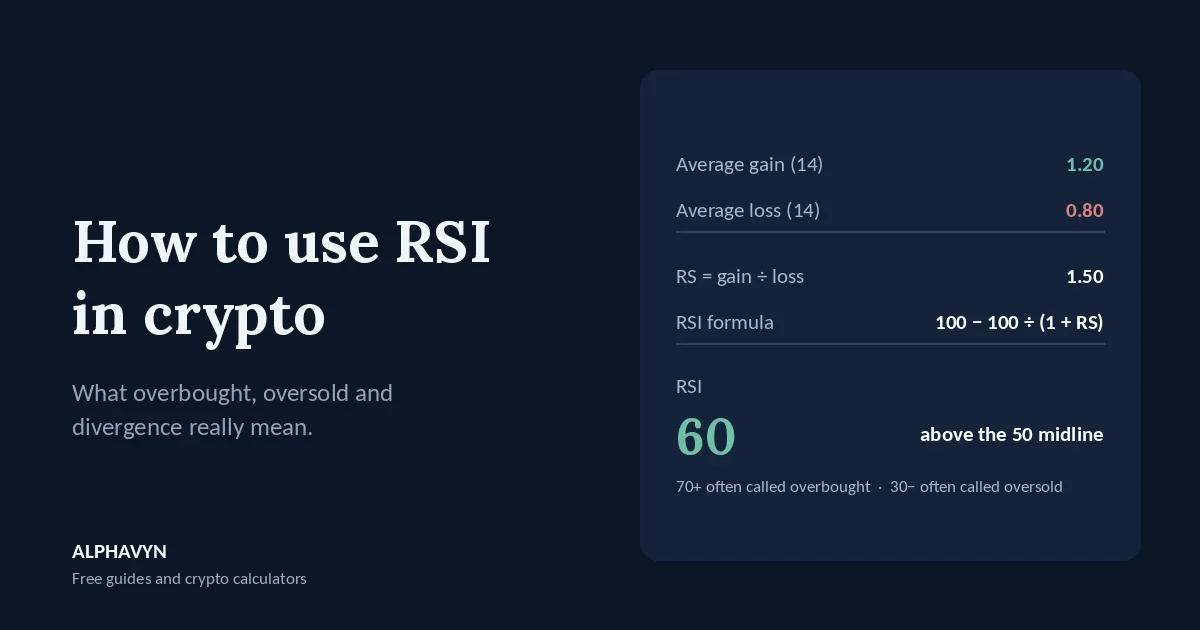
RSI simply compares the average gain with the average loss over the lookback period:
RS = average gain ÷ average loss
RSI = 100 − 100 ÷ (1 + RS)
Example: over the last 14 candles, the average gain was 1.20 and the average loss was 0.80.
RS = 1.20 ÷ 0.80 = 1.5
RSI = 100 − 100 ÷ (1 + 1.5) = 100 − 40 = 60
Here’s how RS translates into RSI:
Average gain vs average loss | RS | RSI |
|---|---|---|
Losses twice as large as gains | 0.5 | 33.3 |
Gains equal to losses | 1 | 50 |
Gains 1.5 times losses | 1.5 | 60 |
Gains three times losses | 3 | 75 |
Notice that RSI doesn’t move in a straight line. Going from 50 to 75 needs gains three times as large as losses, and getting close to 100 needs almost no losses at all. That’s why readings above 80 or below 20 are rare.
Don’t worry about calculating it by hand. Charting tools also smooth the averages over time, so the formula is only there to help you understand what a reading means.
What do overbought and oversold mean?
The most common levels are:
Above 70: overbought. Gains have dominated recently.
Below 30: oversold. Losses have dominated recently.
Here’s the catch: these names are misleading. “Overbought” sounds like price is too high and must fall. It only means price has risen strongly over the last 14 candles. A strong move can keep going, and often does.
StockCharts’ guide to RSI gives the same warning: overbought and oversold readings are conditions, not signals on their own.
Why can RSI stay overbought for weeks?
Because in a strong trend, RSI can sit near the extreme for a long time.
Example: a coin climbs steadily from 100 to 130 over three weeks, with only small pullbacks. Its daily RSI crosses 70 when price reaches 108 and stays between 65 and 82 for most of the move. A trader who sold at the first reading above 70 sold at 108 and missed the move to 130.
So instead of single readings, many traders watch the range RSI moves in. A commonly cited guideline:
In an uptrend, RSI often moves between about 40 and 90, and pullbacks tend to stop around 40 to 50.
In a downtrend, RSI often moves between about 10 and 60, and bounces tend to stall around 50 to 60.
That means in an uptrend, an RSI that keeps holding above 40 on pullbacks can be a sign of strength, not weakness. And in a downtrend, an RSI that keeps failing near 60 shows sellers are still in control.
What does the 50 line tell you?
The 50 line is the balance point between gains and losses. Many traders use it as a simple filter:
RSI holding above 50 supports a bullish reading of momentum.
RSI holding below 50 supports a bearish reading.
RSI crossing 50 shows that the balance of recent moves has shifted.
In the BTC/USDT example in our trend, momentum, volume, and structure guide, RSI was 58: above the midline, but far from stretched. That reading says momentum leans positive, nothing more.
What is RSI divergence?
Divergence happens when price and RSI disagree.
Bearish divergence: price makes a higher high, but RSI makes a lower high.
Example: price rises to 110 with RSI at 74, pulls back, then rises again to a new high at 115. This time, RSI only reaches 66. Price went higher, but the momentum behind it was weaker.
Bullish divergence: price makes a lower low, but RSI makes a higher low.
Example: price falls to 90 with RSI at 24, bounces, then falls to a new low at 86. This time, RSI only drops to 31. Price went lower, but the selling was weaker.
Think of divergence as a warning, not a timing signal. Momentum can weaken for a long time while price keeps grinding the same way, and a series of divergences can appear before anything changes. Many traders wait for price itself to confirm, for example a candle closing back above resistance after bullish divergence, or below support after bearish divergence. Our guide on how to read crypto candlestick charts explains why the close matters more than the wick.
How do I use RSI with support and resistance?
RSI works best when it agrees with what the chart already shows. An oversold reading in the middle of nowhere says little. An oversold reading right at a well-tested support zone says much more.
Example: a coin has bounced from a support zone of 2,180 to 2,220 three times. It falls into the zone again, and the 4-hour RSI drops to 29. Then a 4-hour candle dips to 2,175 but closes at 2,215, with a long lower wick.
Now three pieces of evidence point the same way: price is at support, momentum is stretched to the downside, and the candle shows buyers pushed back. That’s a far stronger case than RSI below 30 alone.
The plan still follows the same steps. Place the stop loss below the zone, where a break would show the idea was wrong, pick a target at the next resistance, and size the position so the stop costs only what you chose to risk, using the position size calculator. Our beginner’s guide to support and resistance explains how to find these zones.
Which RSI settings and timeframes should I use?
Period. 14 is the standard and a good place to start. A shorter period, such as 7, reacts faster and reaches extremes more often, with more false readings. A longer period, such as 21, is smoother but slower.
Levels. 70 and 30 are the defaults. On very volatile coins, some traders use 80 and 20 so that only the most stretched readings stand out.
Timeframe. RSI on 1-minute or 5-minute charts swings wildly and is full of noise. Most beginners get clearer readings on the 4-hour and daily charts. A common approach is to check the daily RSI for the bigger picture, then the 4-hour for timing.
Whatever you choose, keep the same settings long enough to learn how they behave. Changing the period every week just to make a chart “look right” teaches you nothing.
How do I read RSI on the ALPHAVYN chart?
Let’s look at a real one. Here is the BTC/USDT 4-hour chart at 11:24 UTC on 28 October 2026, with price at 81,422.00, up 1.88% over 24 hours. The panel under the volume bars shows RSI with a 14-period setting, and its label reads:
RSI(14, MA 14) RSI: 59.58 MA: 46.41
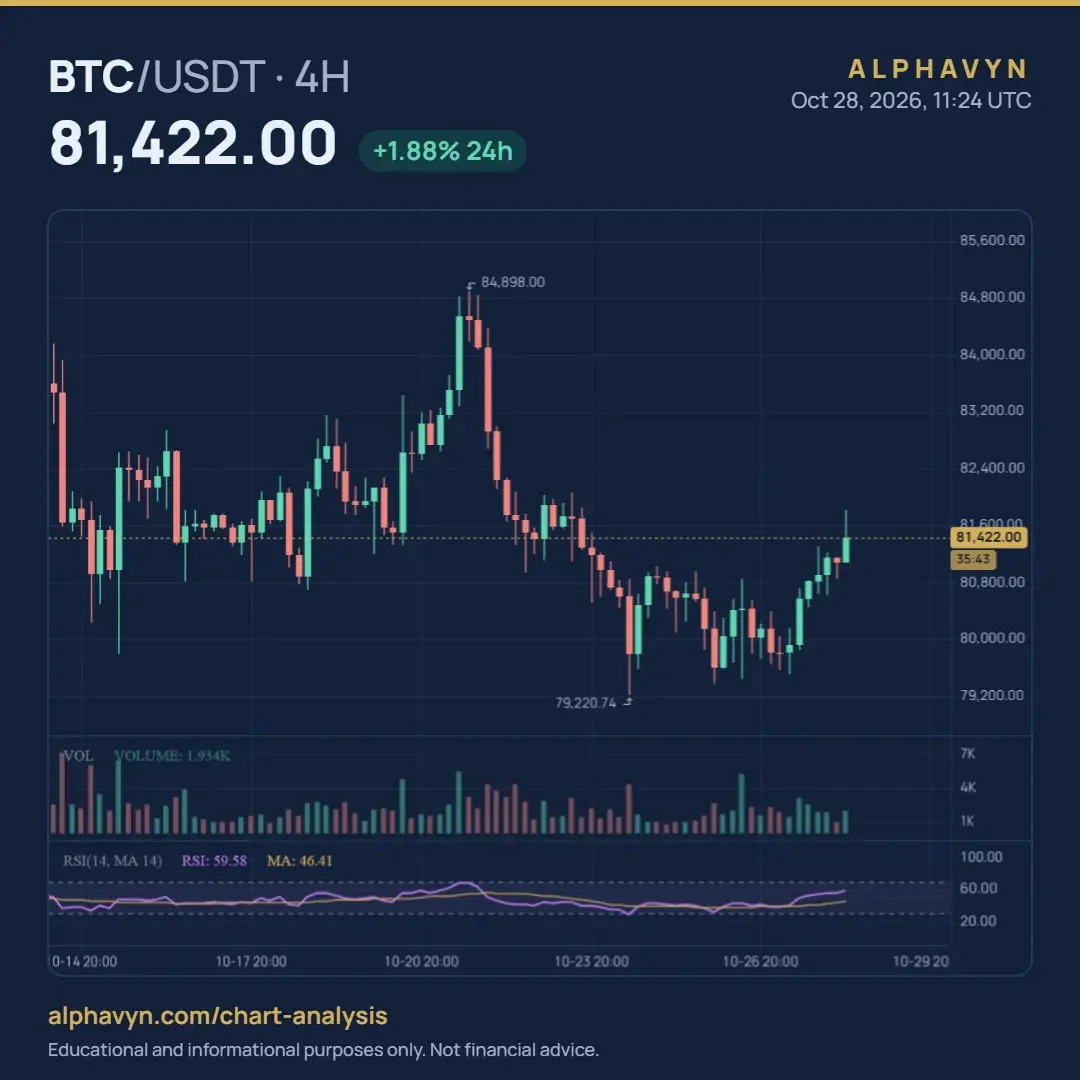
The purple line is RSI. The yellow line is a 14-period moving average of RSI, which smooths it out. The dashed lines mark the 70 and 30 levels. Here’s what the chart is telling us:
RSI is above 50 and below 70. At 59.58, it’s 9.58 above the midline and 10.42 below the 70 line. Using the formula, RS = 59.58 ÷ (100 − 59.58), about 1.47, so recent gains have been about 1.47 times recent losses. Momentum leans positive, but it isn’t stretched.
RSI is well above its own average. The RSI line is 13.17 above its moving average of 46.41. RSI has climbed quickly over the last few days, and its average, still below 50, is only starting to catch up. That makes this a recovery in momentum, not a long stretch of strength.
RSI dropped near 30 when price made its low. Around the 79,220.74 low, RSI fell close to the oversold line. Since then, price is up 2,201.26, about 2.8%, and RSI has moved from the bottom of its range to the upper half.
RSI rose toward 70 near the 84,898 high. As price rallied to 84,898, RSI climbed to around the top of its range. Both then turned down, and price lost 5,677.26, about 6.7%, by the low. This time, the stretched reading came before a drop. As we saw above, that isn’t guaranteed: in a stronger trend, RSI can sit up there for weeks.
In the sideways stretch, RSI stayed in the middle. From about 14 to 19 October, while price moved in a range, RSI hovered roughly between 35 and 50. A quiet market gives a quiet RSI.
Price is still 3,476 below the high. That’s about 4.1% under 84,898, so even with momentum recovering, price hasn’t yet returned to where the last rally peaked.
The last candle is still open. The tag under the price shows 35:43 left on the 4-hour candle, so the RSI of 59.58 is a live reading and can change before the candle closes at 12:00 UTC. It’s the same lesson as with candles: wait for the close before you act on a reading.
So what’s the bottom line? Momentum has moved from stretched-low to moderately positive, without reaching overbought. That’s a reading to note, not a reason to trade by itself. It would carry more weight if price also reached a level on the chart, such as the support and resistance zones we covered above.
How does ALPHAVYN show RSI?
You can add RSI to any USDT pair on the free live crypto charts, alongside volume, moving averages and other indicators, and switch between timeframes to compare readings.
The pair analyzer uses RSI as part of its momentum reading, together with MACD, and shows it next to trend, volume and structure. Think of it as a quick check to support your own research, not a signal.
What are common RSI mistakes?
Most RSI mistakes come down to treating it as a trigger instead of a reading:
Selling every time RSI crosses 70. In strong uptrends, this means selling early again and again.
Buying every time RSI drops below 30. In strong downtrends, oversold can become more oversold.
Trading divergence without confirmation. Divergence can last for many candles before price turns, if it turns at all.
Reading RSI on very short timeframes. The noise hides the signal.
Acting on a candle that hasn’t closed. An open candle can still move RSI a lot before it finishes.
Using RSI alone. RSI measures momentum only. It says nothing about where support and resistance are, or how much trading stands behind a move.
Frequently asked questions
What is the best RSI setting for crypto?
There’s no single best setting. The standard 14-period RSI with 70 and 30 levels is the most widely used, which also means those readings are watched by the most traders. Start there, and only adjust once you understand how it behaves on the coins and timeframes you trade.
Should I sell when RSI is above 70?
Not on that alone. RSI above 70 only means gains have dominated recently, and in a strong uptrend it can stay above 70 for a long time. Many traders look for more evidence first, such as price stalling at resistance, a bearish divergence, or a candle closing below a key level.
Does RSI work on small altcoins?
It can, but it’s less reliable. Coins with low trading volume can jump on a few large orders, which pushes RSI to extremes quickly and can make readings misleading. Keep in mind that crypto assets are volatile, and the U.S. SEC notes that the risk of loss remains significant.
What is the difference between RSI and MACD?
Both measure momentum, but in different ways. RSI compares average gains with average losses on a fixed 0 to 100 scale. MACD compares two moving averages of price and has no fixed range. Many traders use them together, since agreement between the two gives a clearer momentum reading. Our guide on how to use MACD in crypto explains MACD in full.
What is the difference between RSI and Stochastic RSI?
RSI measures the balance of recent gains and losses. Stochastic RSI measures where RSI sits within its own recent range, so it moves faster and reaches the extremes more often. Our guide to Stochastic vs Stochastic RSI explains both.
Try it yourself
Open the free live crypto charts, add RSI to the 4-hour chart of a pair you follow, and mark where it turned near 70, 30 and 50. Then check the same pair in the pair analyzer to see how momentum fits with trend, volume and structure.