The volume bars under your chart tell you when trading happened. Volume Profile flips the question around and tells you where: how much traded at each price level.
That one change shows you which prices the market accepted, where traders spent most of their time, and which levels price flew through without stopping. In this guide, we’ll walk through how Volume Profile is built, what the POC and value area mean, and how to read the green and red parts of each bar, using a real BTC/USDT chart. You can add it to any USDT pair on our free live crypto charts and follow along.
What is Volume Profile?
Think of it as a set of horizontal bars drawn beside your price chart. Each bar covers a small band of prices (we call it a row), and its length shows how much volume traded in that band.
A long bar means a lot of trading happened at those prices.
A short bar means the market barely stopped there.
Normal volume bars answer “how much traded in this candle?” Volume Profile answers “how much traded at this price, across every candle on screen?” It’s the same volume, just shown in a different direction. If you want a refresher on normal volume, our guide to trend, momentum, volume and structure covers it.
How is Volume Profile built?
It’s simpler than it looks. The chart takes the price range of the candles on screen and splits it into a set number of rows (our default is 30). Then it adds each candle’s volume to the rows that candle’s price touched. Each row’s total becomes the length of its bar.
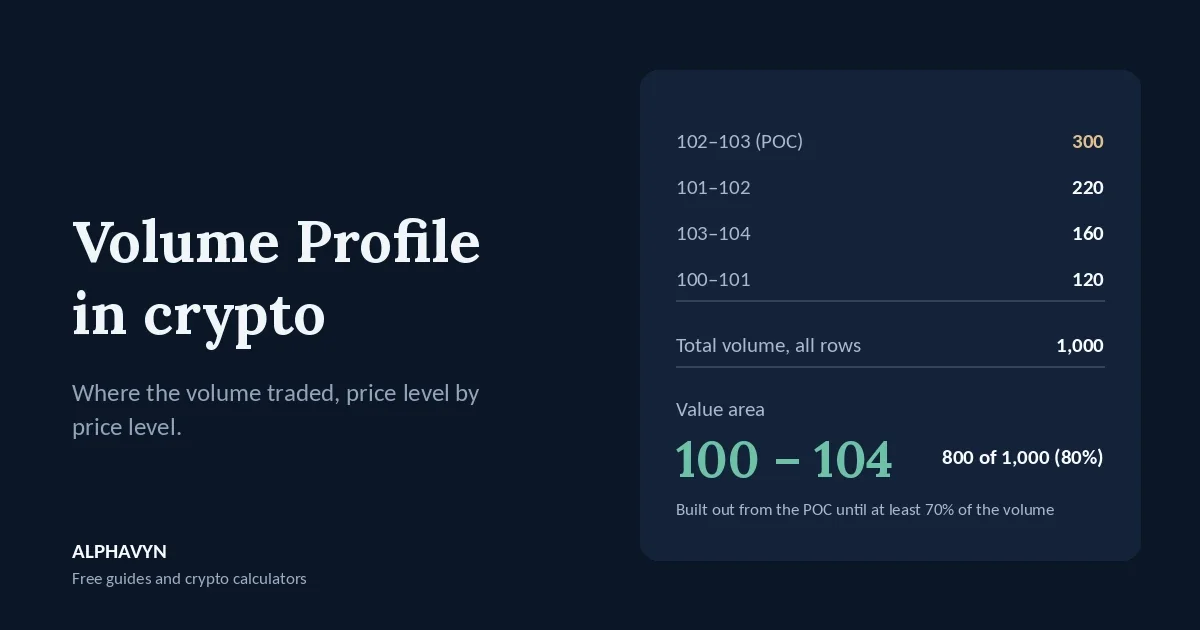
Here’s a small example with seven rows and 1,000 coins of total volume:
Price row | Volume |
|---|---|
105–106 | 40 |
104–105 | 90 |
103–104 | 160 |
102–103 | 300 |
101–102 | 220 |
100–101 | 120 |
99–100 | 70 |
Total | 1,000 |
Look at the longest bar: the 102–103 row, with 300 coins. That’s the most important level in this profile, and it has a name.
What is the point of control (POC)?
The point of control, or POC, is simply the price level with the most volume. In our example, that’s the 102–103 row.
Why does it matter? Because it’s the price where both buyers and sellers were most willing to do business. Lots of traders watch it as a key level. Price often reacts when it comes back to the POC, and when price drifts away, the POC can act like a magnet that pulls it back later.
What is the value area?
The value area is the range of prices where most of the volume traded, usually 70% of it. Let’s build the one from our example, step by step. It grows outward from the POC:
Start with the POC row: 300 coins.
Compare the rows directly above and below, and add the bigger one. Below (220) beats above (160), so the total is now 520.
Compare again. Above (160) beats below (120), so the total is now 680.
Compare once more. Below (120) beats above (90), so the total is now 800. That’s more than 70% of 1,000, so we stop.
The value area runs from 100 to 104 and holds 800 of the 1,000 coins (80%, because the last row we added pushed us past 70%). This is a simplified version of the method, and your chart does all of it automatically.
The top of the value area is the value area high and the bottom is the value area low. Together, they mark the range of prices the market accepted as fair during the period.
What do the green and red parts of each bar mean?
On our chart, every bar is split into two colors:
The green (left) part is volume that traded in up candles at that price.
The red (right) part is volume that traded in down candles at that price.
One thing to keep in mind: every trade has a buyer and a seller, so these colors don’t split buyers from sellers exactly. They tell you whether the volume at a price came mostly while the price was rising or while it was falling. That’s a rough sign of which side was more active there. A mostly green bar hints that buyers were pushing at that level, and a mostly red bar hints that sellers were.
What are high and low volume nodes?
Once you zoom out and look at the shape of the whole profile, two kinds of areas jump out:
High volume nodes are clusters of long bars. Price spent a lot of time there and traded heavily. These areas often act as support or resistance, because many traders have positions around them.
Low volume nodes are gaps of short bars. Price rushed through with little trading. When price comes back to a low volume node, it often zips through it again, heading for the next high volume area.
In our example, the 105–106 and 99–100 rows at the edges are low volume areas, while the rows from 101 to 103 form a high volume node.
How do I read Volume Profile on the ALPHAVYN chart?
Let’s look at a real one. Below is a Volume Profile with 30 rows on the BTC/USDT 4-hour chart at 11:41 UTC on 22 October 2026, with price at 81,918. The chart marks the point of control as POC 83,633.67.
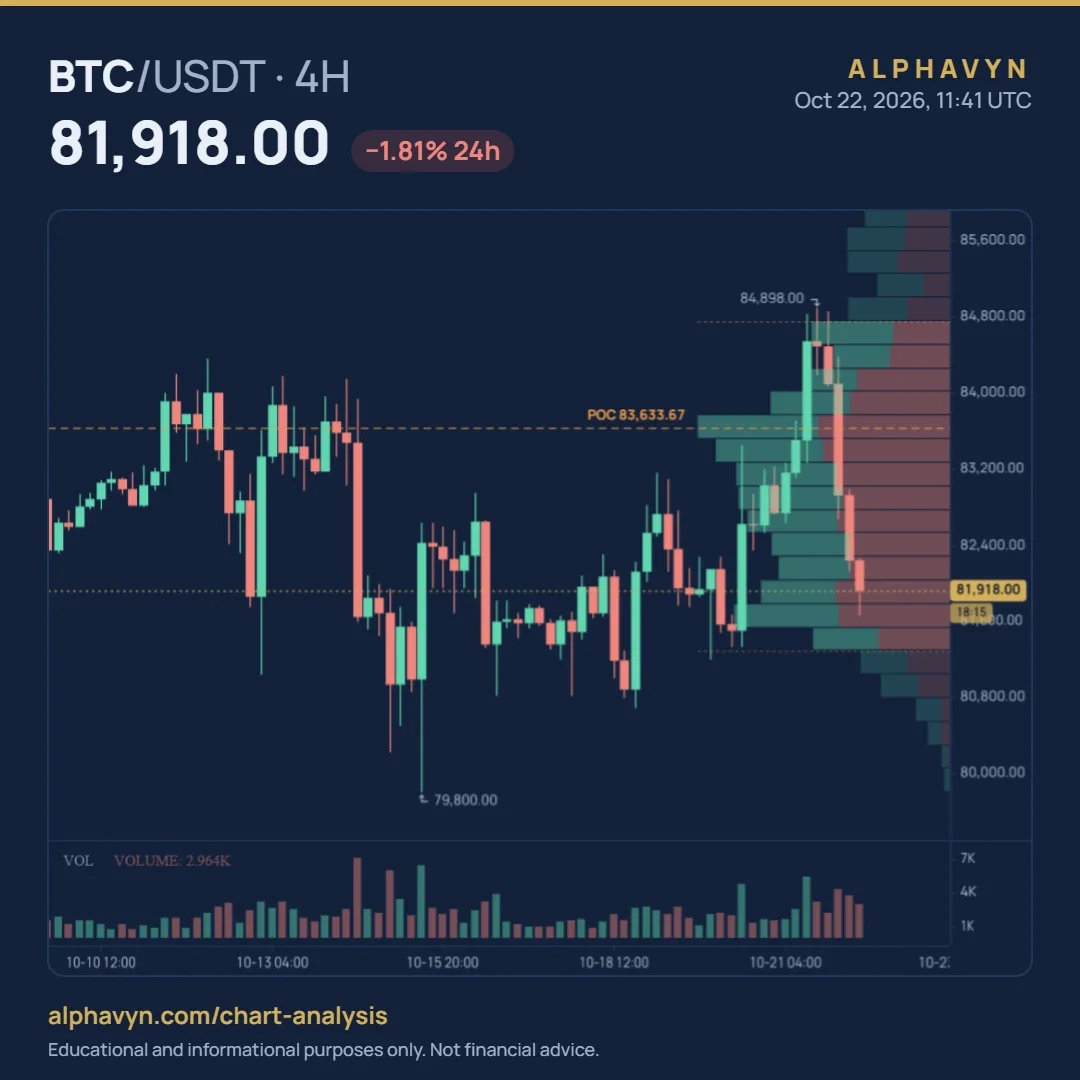
Here’s what you’re looking at:
The orange dashed line is the POC, at 83,633.67. It’s the price with the most volume among the candles on screen.
The two dotted lines are the value area high and the value area low. The brighter bars between them make up the value area, where 70% of the volume traded.
The green and red parts of each bar show the volume from up candles and down candles at that price.
And here’s what the profile is telling us:
Price is below the POC. At 81,918, BTC was 1,715.67 below the POC, about 2.05%. It was trading below the price where most of the period’s volume changed hands.
Price is inside the value area, near its lower edge. It was still within the range the market had accepted, but close to leaving it.
There’s heavy trading near the current price. The long bars around 81,500 to 82,500 come from the sideways trading between about 16 and 20 October.
There’s very little volume near 80,000. The bars around the 79,800 wick are short, because price only passed through that area briefly.
One last tip: the profile is built from the candles on screen, so it changes as you scroll or zoom. Zoom out to see the profile for a longer period, or zoom in for a shorter one.
How do traders use Volume Profile?
As support and resistance. The POC and the edges of the value area are levels people watch. Price falling toward the POC from above often finds buyers there, and price rising toward it from below often meets sellers. Treat each one as a zone, not an exact price. Our beginner’s guide to support and resistance explains why.
To spot quick moves. If price leaves a high volume node and enters a low volume gap, it often travels fast to the next high volume area. That can help you judge whether a target is realistic.
To read acceptance. When price moves outside the value area and candles keep closing there, the market may be accepting a new range. When price pokes out and quickly returns, that move was rejected. Our guide on how to read crypto candlestick charts explains why the close matters more than the wick.
To place stops more carefully. A stop placed in the middle of a high volume node can get hit by normal back-and-forth trading. Many traders prefer stops just beyond the edge of a node. Our guide on where to place a stop loss in crypto shows how to choose a level, and the position size calculator sizes the trade from it.
How is Volume Profile different from VWAP?
They sound similar, but they work differently:
Volume Profile | VWAP | |
|---|---|---|
Shows | Volume at each price level | One average price, weighted by volume |
Drawn as | Horizontal bars beside the chart | A line across the chart |
Key level | The POC: the single busiest price | VWAP itself: the average price paid |
Changes with | The candles on screen | The period it starts from |
They answer related questions. Volume Profile shows where the most trading happened, and VWAP shows the average price of all that trading. When the POC and VWAP sit close together, that area tends to matter even more. Our guide on what is VWAP in crypto covers VWAP in detail.
Should I change the number of rows?
The default of 30 rows is a good balance, but you can change it in the indicator settings:
More rows give a more detailed profile, with thinner bars and more precise levels, but also more noise.
Fewer rows give a simpler profile, with wider bars and clearer main areas, but less precision.
Changing the rows changes how the profile looks, not the volume behind it. If the POC moves after you change the setting, that’s only because the volume is now grouped into wider or narrower bands.
What are the limits of Volume Profile?
Like every indicator, it has weak spots. Keep these in mind:
It depends on the candles on screen. Scroll or zoom, and the POC and value area move. Compare levels using the same view.
It shows the past. A high volume node tells you where trading happened, not where price will go next.
Green and red are not a perfect buyer-seller split. They show volume from up and down candles, which is only a rough sign of which side was more active.
Small coins can mislead. On low-volume pairs, a few large trades can create a POC that means very little.
If you want to see whether volume has been flowing into up moves or down moves over time, take a look at our guide to the OBV indicator in crypto.
Frequently asked questions
What is the POC in Volume Profile?
The POC, or point of control, is the price level with the most traded volume among the candles on screen. On our chart, it’s marked with an orange dashed line and its price.
What does the value area tell you?
The value area is the range of prices where 70% of the volume traded. It shows the range the market accepted as fair during the period. A move outside it, with candles closing there, can show the market moving to a new range.
Does Volume Profile work in crypto?
Yes. Crypto trades around the clock, and Volume Profile works on any pair with volume data. It’s most useful on busy pairs such as BTC/USDT, where the volume reflects a lot of trading. Crypto assets are volatile, and the U.S. SEC notes that the risk of loss remains significant.
Why does the profile change when I zoom?
Because it’s built from the candles on screen. Zooming out includes more candles, so the profile covers a longer period, and zooming in covers a shorter one.
Try it yourself
Open the free live crypto charts, add Volume Profile to the 4-hour chart of a pair you follow, and note where the POC and value area sit compared with the current price. Then zoom out and see how the profile changes over a longer period. It takes two minutes, and you’ll understand it far better than from reading alone.