Price shows what the market is paying. Volume shows how much is being traded. Open interest shows something neither of them can: how many futures positions are still open, waiting to be closed. When it climbs, more traders are committing to a position; when it drops, positions are being closed or forced out. Read together with price, it helps explain what’s behind a move. This guide explains what open interest counts, why coins and USD tell different stories, how to read it with price, and what its limits are, using a real BTC/USDT chart. You can add it to pairs with a perpetual futures contract on our free live crypto charts.
What is open interest?
Open interest is the total number of futures contracts that are open and haven’t been closed yet.
Every futures contract has two sides: a buyer who is long and a seller who is short. Open interest counts each contract once, not once per side. If one trader is long 1 BTC and another is short 1 BTC against them, open interest is 1 BTC.
Open interest only exists for futures. When you buy a coin on the spot market, you simply own it, and there’s no contract to stay open. If futures are new to you, our guide to long vs short in crypto explains how they work.
How does open interest change?
Open interest changes only when positions are opened or closed, not with every trade. Three cases cover everything:
What happens | Example | Open interest |
|---|---|---|
Two traders both open new positions | A opens a 1 BTC long, B opens a 1 BTC short | Rises by 1 BTC |
One trader closes, a new trader takes the other side | A closes the long by selling to C, who opens a new long | Unchanged |
Two traders both close | A closes the long, B closes the short | Falls by 1 BTC |
So open interest rises when new positions open, and falls when positions close, whether traders close them by choice or the exchange closes them through liquidation. Our guide to the crypto liquidation price explains how forced closes happen.
What is the difference between open interest and volume?
Volume | Open interest | |
|---|---|---|
Counts | Every trade during a period | Positions still open at a moment |
Resets | Starts from zero each candle | Carries over from candle to candle |
A trade that closes a position | Adds to volume | Lowers open interest |
A day can have huge volume and almost no change in open interest, if most trades simply pass positions from one trader to another. Volume shows activity; open interest shows commitment.
Should I look at open interest in coins or in USD?
Open interest can be shown in two units, and they don’t always move together.
In coins, it counts how many coins’ worth of contracts are open. It changes only when positions open or close.
In USD, it multiplies the coins by the current price. It changes when positions open or close, and when the price moves.
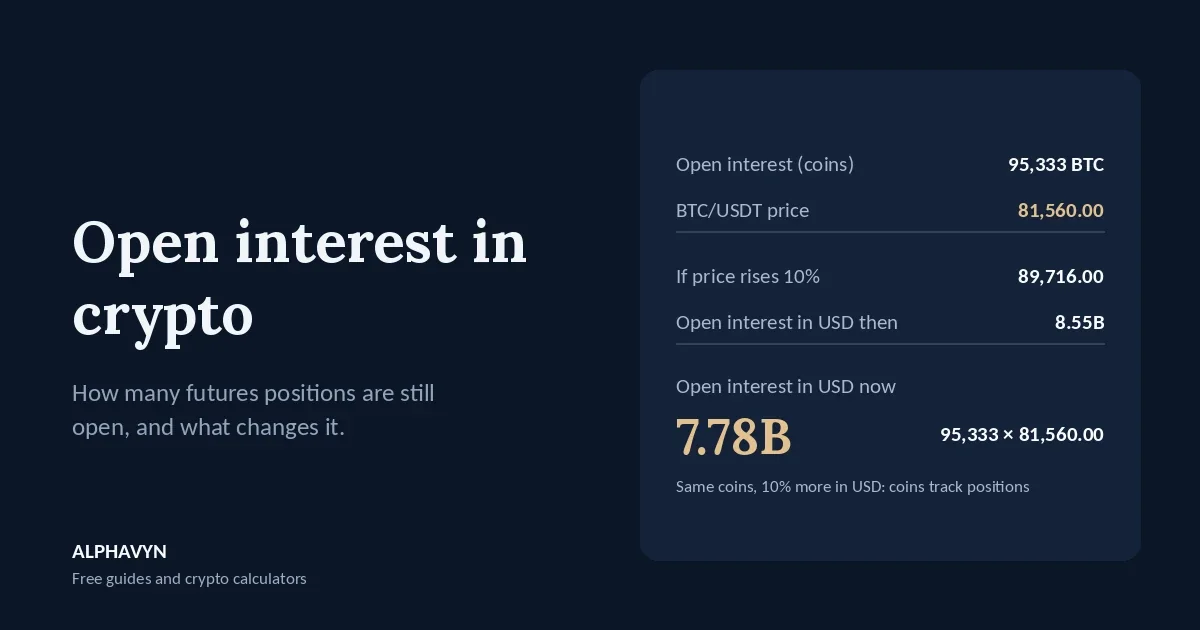
Example: BTC open interest is 95,333 coins with the price at 81,560.
Open interest in USD = 95,333 × 81,560 ≈ 7.78 billion USD
Now imagine the price rises 10% to 89,716, and not a single position opens or closes:
Open interest in coins: still 95,333
Open interest in USD: 95,333 × 89,716 ≈ 8.55 billion USD
USD open interest rose 10% only because the price rose. That’s why coins are usually better for judging whether traders are opening or closing positions. On our chart, coins is the default, and you can switch to USD in the indicator settings.
How do I read open interest with price?
Open interest means most when you compare its direction with the price’s direction. A common way to read the four combinations:
Price | Open interest | A common reading |
|---|---|---|
Rising | Rising | New positions are opening as the price rises; the move has fresh commitment behind it |
Rising | Falling | The rise is coming mainly from positions closing, such as shorts buying back |
Falling | Rising | New positions are opening as the price falls; often new shorts building |
Falling | Falling | Positions are closing as the price falls, such as longs selling or being liquidated |
These are readings, not certainties. Every contract has a long and a short, so rising open interest always means both new longs and new shorts. The table only describes which side seems to be pushing the price, and it can be wrong.
Why does high open interest matter?
When open interest is high, a lot of positions are open, and many of them use leverage. That doesn’t tell you which way the price will go, but it does mean a sharp move can force many positions closed at once.
If the price drops quickly, leveraged longs near their liquidation prices get closed. Those forced sells push the price down further, which can reach the next group of liquidation prices. The same can happen upward with shorts. Open interest usually falls sharply during these moves, because positions are being closed in large numbers.
This is one more reason ALPHAVYN does not recommend leverage: when the market is crowded with leveraged positions, ordinary moves can turn into fast, forced ones.
How do I read open interest on the ALPHAVYN chart?
Here is open interest in coins, with its 20-candle average, on the BTC/USDT 4-hour chart at 10:51 UTC on 20 October 2026, with the price at 81,560. The label reads:
Open interest (coins, MA 20) OI: 95,333 MA: 94,315
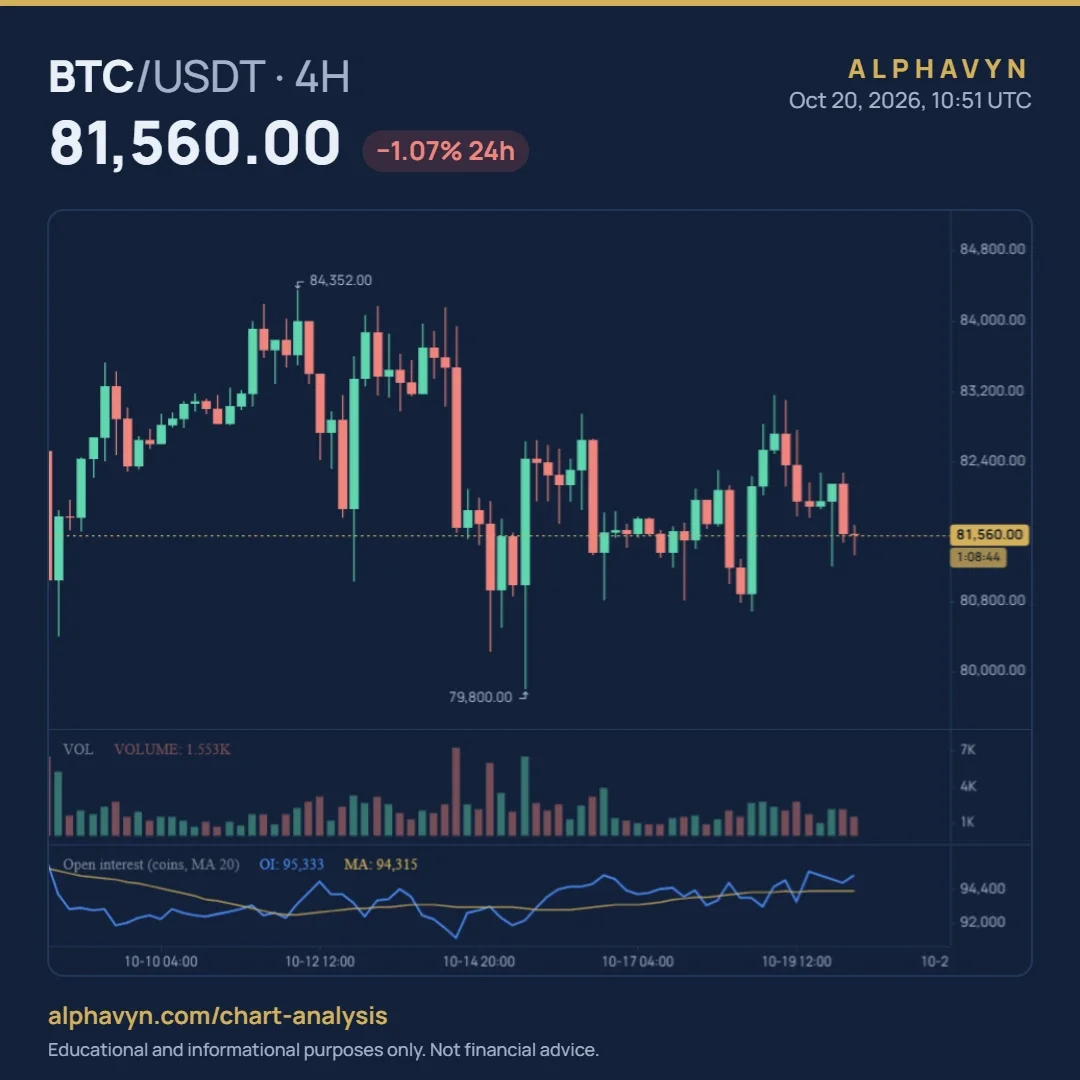
OI is the open interest now: 95,333 BTC.
MA is the average open interest over the last 20 candles: 94,315 BTC.
Open interest is 1,018 BTC above its 20-candle average, so slightly more positions are open now than usual for the period, while the price has been moving sideways.
The chart also shows three of the four combinations from the table:
Rising price, falling open interest. At the start of the chart, around 9 and 10 October, the price climbed while open interest fell. The rise came mainly from positions closing, not from new ones opening.
Falling price, falling open interest. On 14 and 15 October, the price dropped from near the 84,352 high area to a wick at 79,800, and open interest fell to its lowest point on the chart. Positions were being closed or forced out as the price fell.
Rising price, rising open interest. After that low, the price recovered and open interest rose back above its average. New positions opened along with the rebound.
You can turn the average line on or off, change its length from the default 20, and switch between coins and USD in the indicator settings.
How do I use open interest with other tools?
Open interest explains what’s behind a move; it doesn’t show where the key levels are or which way momentum is turning. It works best with:
Volume. A breakout on high volume with rising open interest has more commitment behind it than one on quiet trading with falling open interest. Our guide to trend, momentum, volume and structure explains how to read volume.
Funding rate. Funding shows whether longs or shorts are paying to keep their positions open. High open interest with strongly positive funding shows a market crowded with longs. Our guide to the crypto liquidation price explains funding, and you can add the funding rate on our chart too.
Support and resistance. Liquidations often cluster just beyond obvious levels. Our beginner’s guide to support and resistance explains how to find them.
Is open interest useful if I only trade spot?
Yes. You don’t need to trade futures to use futures data. Spot and futures prices move closely together, so a market crowded with leveraged futures positions affects spot prices too. Watching open interest helps you notice when the market is unusually crowded, and a sharp move is more likely, which is a good reason to keep your own position small and your stop loss in place. Our guide to crypto risk management for beginners covers the basics.
What are the limits of open interest?
It doesn’t show direction. Every contract has a long and a short. Rising open interest doesn’t mean more traders are bullish.
USD readings move with the price. Use coins to judge positions opening or closing.
Only futures pairs have it. Coins without a perpetual futures contract have no open interest to show.
The readings are interpretations. The price and open interest combinations describe what probably happened, not what will happen next.
Frequently asked questions
Is rising open interest bullish?
Not on its own. Rising open interest means new positions are opening, both longs and shorts. Whether that supports the price depends on what the price is doing. Rising open interest with a rising price shows fresh commitment to the move; rising open interest with a falling price often shows new shorts building.
What does a sudden drop in open interest mean?
Many positions closed in a short time. During a sharp price move, that’s often a sign of liquidations: leveraged positions being closed automatically. After it, the market is usually less crowded.
Why do coins and USD show different open interest?
USD open interest is coins multiplied by the price, so it rises and falls with the price even when no positions change. Coins only change when positions open or close.
Which coins have open interest?
Only pairs with a perpetual futures contract, such as BTC, ETH or SOL. Crypto assets are volatile, and the U.S. SEC notes that the risk of loss remains significant.
Open the free live crypto charts, add Open interest to the 4-hour chart of BTC/USDT with the average line on, and compare its direction with the price over the last few days. Then add the funding rate to see which side has been paying.