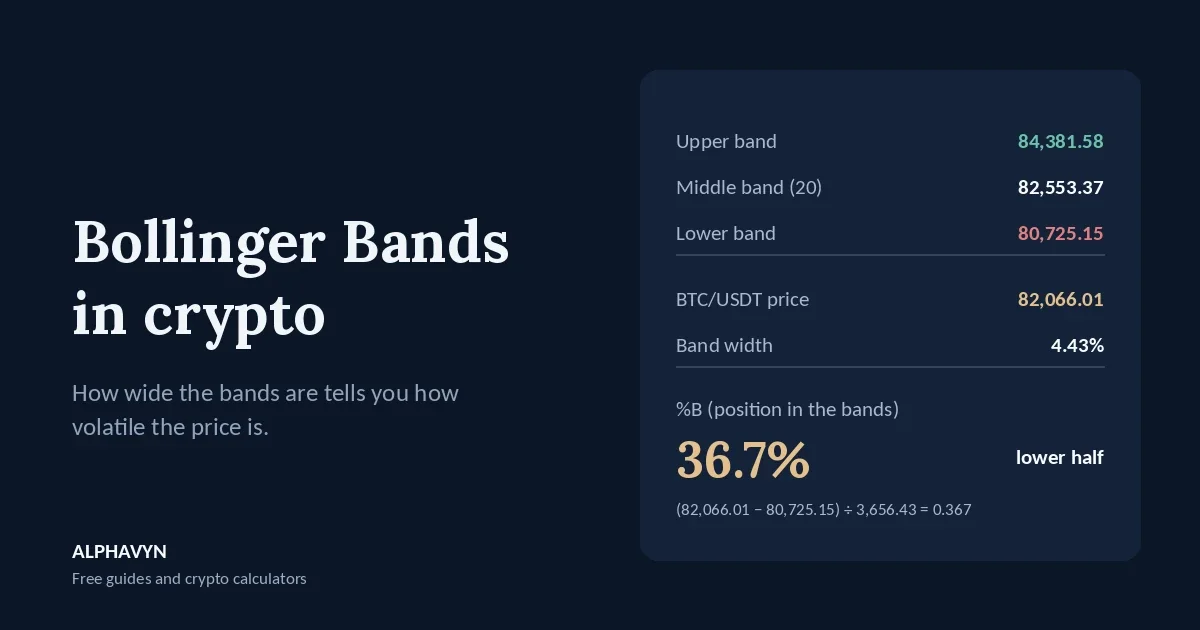
Most indicators tell you about direction or momentum. Bollinger Bands tell you something different: how much the price is moving compared with normal. When the market is calm, the bands pull in close to the price. When it gets volatile, they spread far apart. That simple picture helps you see when a coin is unusually quiet, when a move is stretched, and when a trend is strong enough to keep pressing against one side. This guide explains how the bands are calculated and how to read them, using a real BTC/USDT chart. You can add Bollinger Bands to any USDT pair on our free live crypto charts.
What are Bollinger Bands?
Bollinger Bands were developed by John Bollinger in the 1980s. They are three lines drawn on the price chart:
Band | What it is |
|---|---|
Middle band | A 20-period moving average of the closing price |
Upper band | The middle band plus 2 standard deviations |
Lower band | The middle band minus 2 standard deviations |
The standard settings are written as BOLL (20, 2): a period of 20 candles and a width of 2 standard deviations.
The middle band shows the average price. The outer bands show how far the price usually strays from that average, given how volatile it has been recently. If moving averages are new to you, our guide to moving averages in crypto explains how they work.
What is standard deviation?
Standard deviation measures how spread out prices are around their average. If the last 20 closes were all very close to each other, the standard deviation is small. If they were scattered widely, it’s large.
Example: a 5-period version, to keep the numbers short. The last five closes were 98, 102, 100, 104 and 96.
Average = (98 + 102 + 100 + 104 + 96) ÷ 5 = 100
Distance of each close from the average: −2, +2, 0, +4, −4
Squared distances: 4, 4, 0, 16, 16, which add up to 40
Average of the squared distances: 40 ÷ 5 = 8
Standard deviation = √8 ≈ 2.83
With a width of 2, the bands would sit 2 × 2.83 = 5.66 away from the average: an upper band at 105.66 and a lower band at 94.34.
Your chart does this automatically for every candle. What matters is the idea: a bigger spread of recent prices means wider bands.
How do I read Bollinger Bands on the ALPHAVYN chart?
When you add Bollinger Bands on our free live crypto charts, a label shows the current value of each band. Here is the BTC/USDT 4-hour chart at 04:00 UTC on 16 October 2026, with the price at 82,066.01:
BOLL(20,2) Upper: 84,381.58 Mid: 82,553.37 Lower: 80,725.15
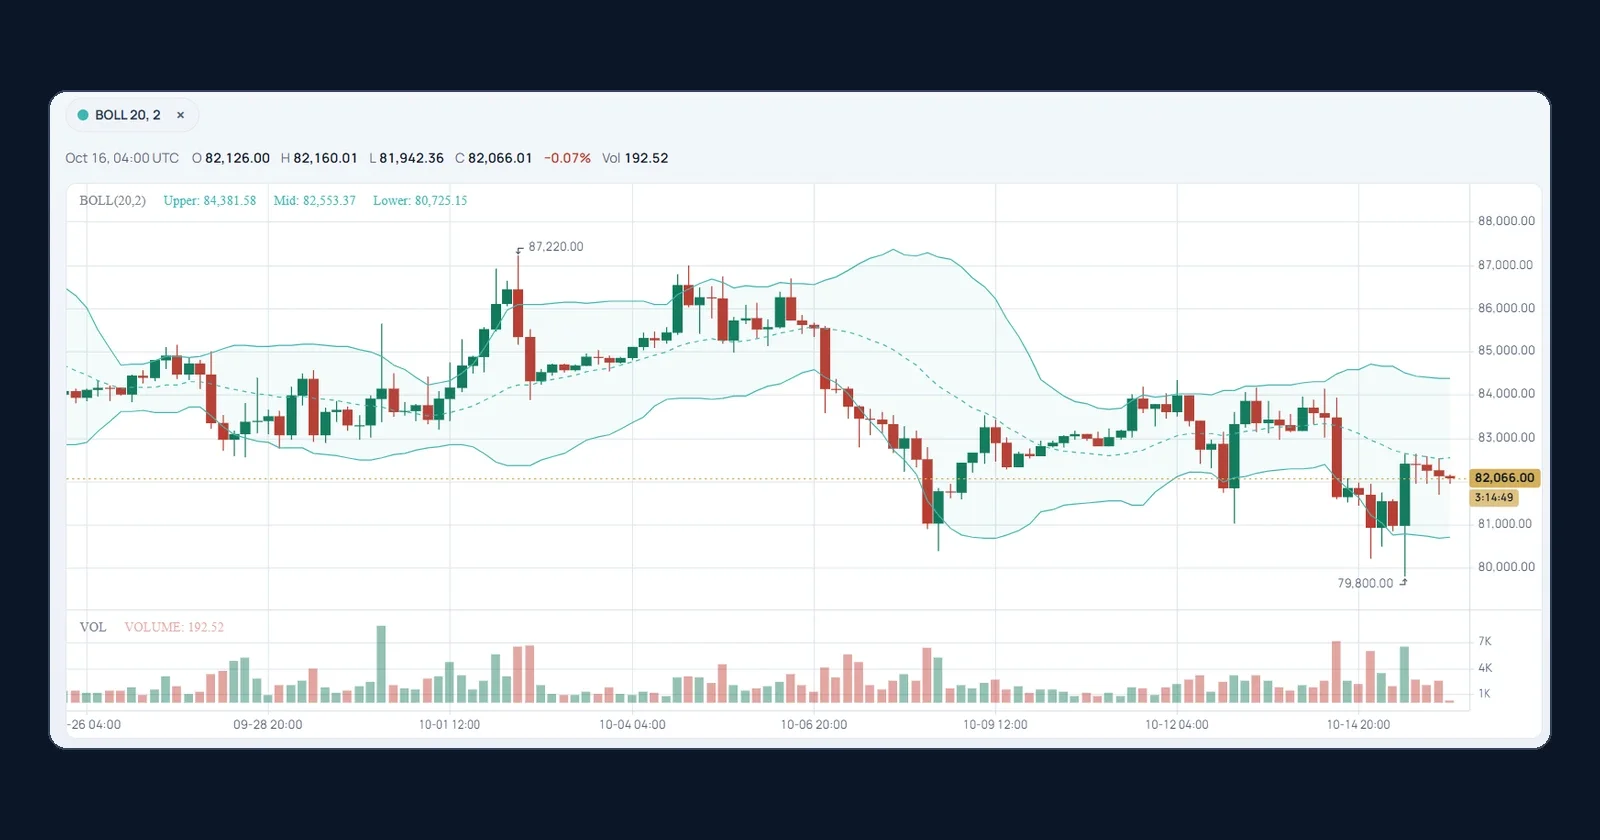
The upper and lower bands sit the same distance from the middle:
84,381.58 − 82,553.37 = 1,828.21
82,553.37 − 80,725.15 = 1,828.22
That distance is 2 standard deviations, so one standard deviation of the last 20 closes was about 914. On this chart, a “normal” 4-hour close was within roughly 900 of the 20-candle average.
The price, at 82,066.01, was below the middle band but well above the lower one: slightly weaker than average, but not stretched.
You can change the period and the standard deviation from the default 20 and 2 in the indicator settings.
What does the band width tell you?
The distance between the upper and lower bands shows how volatile the price has been. To compare it over time, many traders divide it by the middle band to get a percentage, often called BandWidth:
Band width = (upper band − lower band) ÷ middle band
In the example:
(84,381.58 − 80,725.15) ÷ 82,553.37 = 3,656.43 ÷ 82,553.37 = 4.43%
So the bands covered a range of about 4.4% of the price. A smaller number means a calmer market; a larger number means a more volatile one. Because it’s a percentage, you can compare band width across coins with very different prices, which you can’t do with the raw band values.
What is %B?
%B shows where the price sits inside the bands, as a percentage:
%B = (price − lower band) ÷ (upper band − lower band)
In the example:
(82,066.01 − 80,725.15) ÷ 3,656.43 = 1,340.86 ÷ 3,656.43 = 0.367, or 36.7%
%B | Where the price is |
|---|---|
100% | At the upper band |
50% | At the middle band |
0% | At the lower band |
Above 100% | Above the upper band |
Below 0% | Below the lower band |
A %B of 36.7% means the price was in the lower half of the bands, about a third of the way up from the lower band. %B is useful when you want one number instead of eyeballing the chart.
What is a Bollinger Band squeeze?
A squeeze is when the bands narrow to their tightest point in a while. It shows the price has been unusually calm, and calm periods often don’t last. Volatility tends to come in cycles: quiet stretches are frequently followed by bigger moves.
The BTC/USDT chart shows this clearly. Between about 11 and 13 October, the bands narrowed to roughly 82,800 to 84,200 while the price drifted sideways. On 14 and 15 October, the price broke lower, the bands spread apart again, and a long wick briefly reached 79,800.
A squeeze tells you a bigger move may be coming. It doesn’t tell you which direction. The price can break out of a squeeze in either direction, and a first move out of the bands can reverse. Many traders wait for a candle to close outside a nearby support or resistance level before trusting the direction. Our guide on how to read crypto candlestick charts explains why the close matters more than the wick.
Does touching the upper band mean the price will fall?
No. This is the most common Bollinger Bands mistake. The upper band isn’t a ceiling and the lower band isn’t a floor. They only show that the price has moved far from its recent average.
In a strong trend, the price can ride the band: candles keep closing near or even outside one band for many periods, while the bands spread wider.
The same BTC/USDT chart shows both behaviors:
A reversal from the band. Around 1 and 2 October, a spike pushed above the upper band to 87,220, then the price fell back inside the bands and dropped toward the middle band.
Riding the band. Between about 6 and 8 October, the price fell from around 86,000 toward 80,500, with candles hugging and closing below the lower band as the bands widened sharply. Buying every touch of the lower band during that fall would have meant buying again and again into a falling market.
The difference is context. A touch of an outer band in a sideways market often snaps back toward the middle. A touch in a strong trend often means the trend is strong.
How do I use the middle band?
The middle band is a 20-period moving average, so it works like one:
In an uptrend, pullbacks often stop near the middle band, and the price spends most of its time between the middle and upper bands.
In a downtrend, bounces often stall near the middle band, and the price spends most of its time between the middle and lower bands.
A clear break of the middle band against the trend can be an early sign the trend is weakening.
In the example, the price was below the middle band at 82,553, which fits the weaker picture after the drop on 14 and 15 October.
How do I use Bollinger Bands with other tools?
Bollinger Bands show volatility and how stretched the price is. They don’t show momentum, or where the key levels are, so they work best with other tools:
Support and resistance. A touch of the lower band that lines up with a well-tested support zone carries far more weight than a touch in the middle of nowhere. Our beginner’s guide to support and resistance explains how to find these zones.
Momentum. If the price touches the lower band while RSI makes a higher low, selling may be weakening. Our guide on how to use RSI in crypto explains divergence, and our guide on how to use MACD in crypto shows how the histogram reveals fading momentum.
Volume. A break out of a squeeze on high volume is more convincing than one on very quiet trading.
Whatever the bands suggest, the trade still needs a stop loss where the idea would be wrong. On a volatile coin, a stop placed just inside the bands is often hit by normal swings. Our guide on where to place a stop loss in crypto covers volatility-based stops, and the position size calculator sizes the trade from that distance.
Should I change the Bollinger Bands settings?
The default 20 and 2 are by far the most widely used, and a good place to start. You can change both on our chart:
A shorter period (for example 10) makes the bands follow the price more closely and react faster.
A longer period (for example 50) makes them smoother and slower.
A smaller standard deviation (for example 1.5) brings the bands closer, so the price touches them more often.
A larger standard deviation (for example 2.5) pushes them out, so touches are rarer and more extreme.
Changing the settings doesn’t make the bands more accurate. It changes how often the price reaches them. Keep the same settings long enough to learn how they behave on the coins and timeframes you trade.
Bollinger Bands on 1-minute or 5-minute charts expand and contract constantly. Most beginners get clearer readings on the 4-hour and daily charts.
What are common Bollinger Bands mistakes?
Selling every upper band touch and buying every lower band touch. In strong trends, the price can ride a band for a long time.
Assuming a squeeze shows the direction. It only shows that a bigger move may be coming.
Trusting the first move out of a squeeze. It can be a fake move that quickly reverses.
Comparing band values between coins. Use band width as a percentage instead.
Using the bands alone. They say nothing about support, resistance or momentum on their own.
Frequently asked questions
What are the best Bollinger Bands settings for crypto?
The standard 20-period, 2-standard-deviation setting is the most widely used and a good starting point. Some traders widen the bands on very volatile coins so touches are rarer. Whatever you choose, use it consistently so you learn how it behaves.
Do prices always stay inside the bands?
No. Most closes stay inside the bands, but not all. Crypto prices often make sudden moves that push well outside them, especially during strong trends or news-driven spikes, like the wick to 79,800 in the BTC/USDT example.
What is the difference between Bollinger Bands and Keltner Channels?
Both draw bands around a moving average. Bollinger Bands set the width with standard deviation, while Keltner Channels use ATR, the average range of recent candles. Keltner Channels usually change width more smoothly. You can add both on our free live crypto charts to compare them.
Our guide to Keltner vs Donchian Channels in crypto explains how Keltner Channels are built and read.
Are Bollinger Bands reliable in crypto?
They’re a useful way to see volatility and how stretched the price is, but no indicator is reliable on its own. Crypto assets are volatile, and the U.S. SEC notes that the risk of loss remains significant.
Open the free live crypto charts, add Bollinger Bands to the 4-hour chart of a pair you follow, and look for the last squeeze and what happened after it. Then check the same pair in the pair analyzer to see its trend, momentum, volume, and structure.